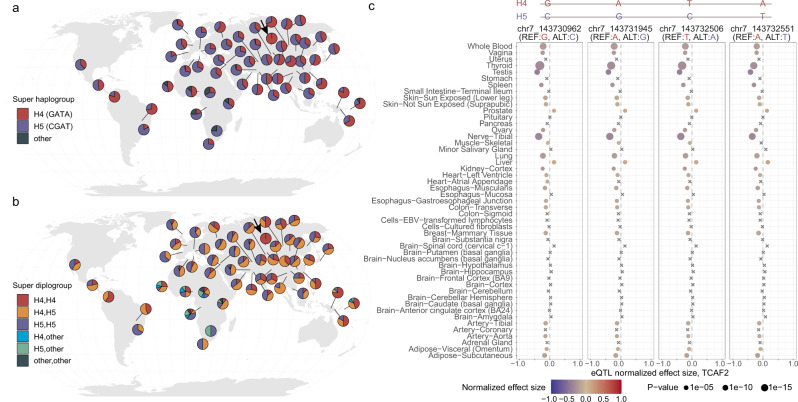
Fig. 6. H4 and H5 super haplogroup distribution and eQTL analysis.
Four tagging SNVs were first identified by perfectly separating super haplogroups H4 and H5 among the seven BAC haplogroups and confirmed based on patterns of linkage disequilibrium (LD) in samples from the HGDP panel. a, b Distributions of super haplogroups H4 (red, 57.1%) and H5 (blue, 40.3%) and their diploid type in the HGDP populations across the world. Other haplotypes were found in ~2.6% of the samples. Note that archaic hominin haplotypes from the Neanderthal (n = 3) and Denisovan (n = 1) samples all carry H4 haplotypes, and as a representation the geographic location of these samples was placed in the Altai Mountains in Siberia (arrows). These maps were generated using the R packages rgdal (v1.5), scatterpie (v0.1.6), and Natural Earth. c Multi-tissue eQTL plots show consistent patterns of associations between the four tagging SNVs and expression levels of TCAF2 across 50 tissues. Effect sizes were calculated as the effect of the alternative allele (blue) relative to the reference allele (read) as defined in GTEx (release v8) and are scaled using color. The (unadjusted) p values of eQTL association are computed by testing the alternative hypothesis that the slope of a linear regression model between genotype and expression deviates from 0 and represented by dot sizes. Note that crosses (×) indicate insignificant associations.

