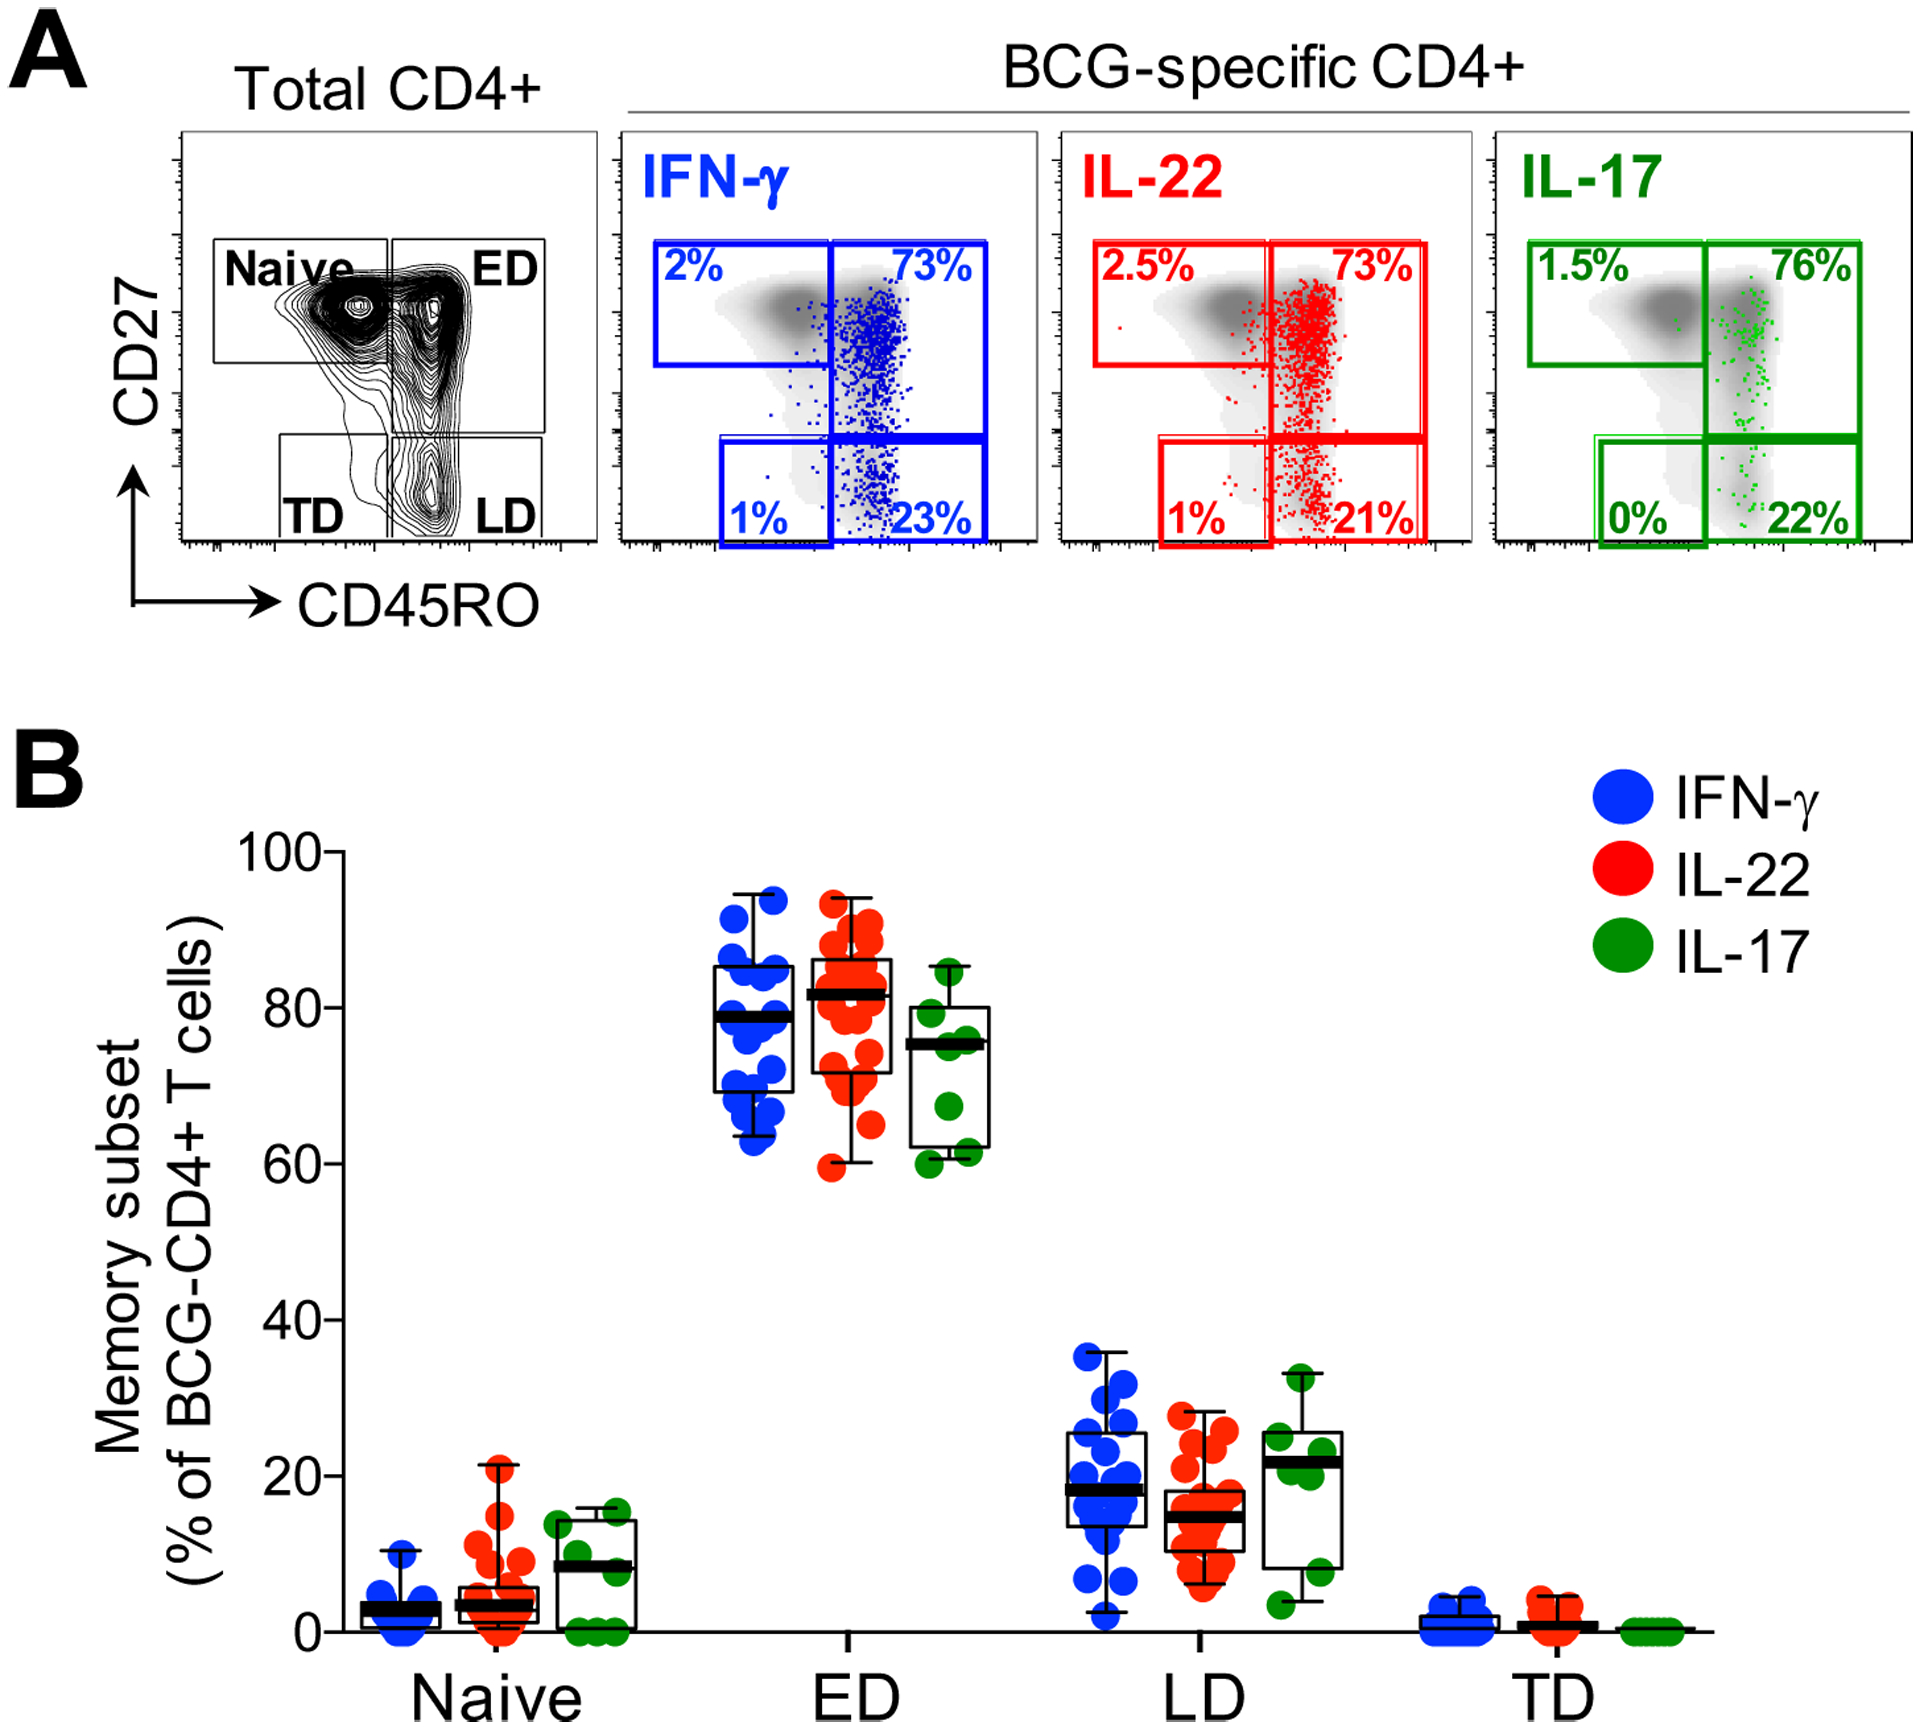
Figure 4: Memory profiles of CD4+ T cells producing IFN-γ, IL-22 or IL-17A in response to BCG.

(A) Representative flow cytometry plots of total CD4+ memory subset distribution in one individual based on CD45RO and CD27 staining. Naïve: CD45RO-CD27+, early differentiated (ED: CD45RO+CD27+), late differentiated (LD: CD45RO+CD27-) and terminally differentiated (TD: CD45RO-CD27-). The overlays indicate the antigen specific CD4+ T cells producing IFN-γ (blue), IL-22 (red) or IL-17A (green). The frequencies of each subset are indicated. (B) The memory distribution of cells producing IFN-γ (blue), IL-22 (red) or IL-17A (green) in response to BCG (n=20, 25 and 7, respectively). Only individuals with a positive cytokine response and more than 30 cytokine events were included in the phenotyping. Each dot represents one individual. Data are shown as box and whisker (interquartile range) plots and horizontal bars represent the median. Statistical comparisons were performed using Kruskal-Wallis and Dunn’s multiple comparison test.
