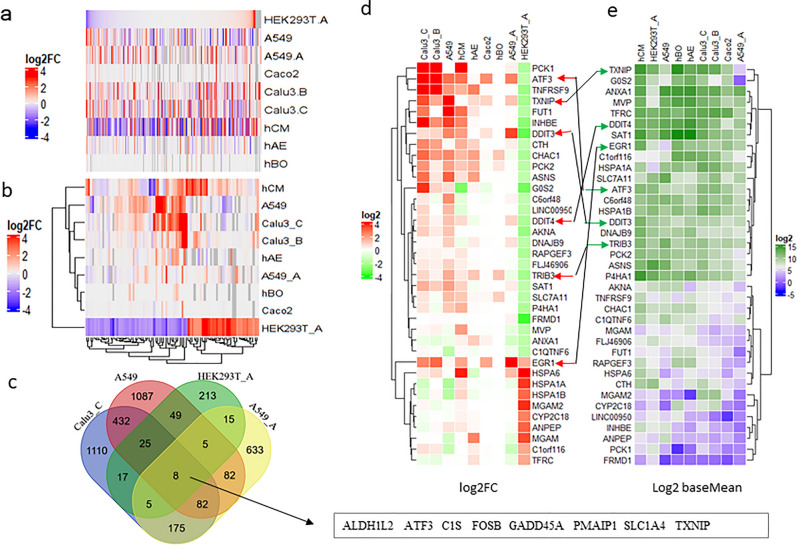
Figure 4.
Common DEGs and genes of interest. (a) Heatmap view of the log2FC value of all genes in SARS-CoV-2 infected HEK293T-hACE2 cells versus those in other infected cell lines. Grey color indicates that the log2FC value are not available in the cell lines. (b) Heatmap view of genes with the log2FC value ≥ 2 or log2FC ≤ -1.5 in SARS-CoV-2 infected HEK293T-hACE2 cells versus those in other infected cell lines. Grey color indicates the log2FC value is not available in the cell lines. (c) Venn Diagram showing 8 common DEGs of infection in HEK293T-hACE2, A549, A549-hACE2, and Calu3_C cells. (d) Heatmap view of log2FC value of genes of interest. (e) Heatmap view of baseMean value (mean gene expression level calculated by DEseq2) of genes of interest. HEK293T_A/HEK293T.A and A549_A/A549.A represent HEK293T or A549 with hACE2 overexpression, respectively. Calu3_B/Calu3.B and Calu3_C/Calu3.C represent data by Wyler E. (bioRxiv) and Blanco-Melo D. (Cell), respectively.

