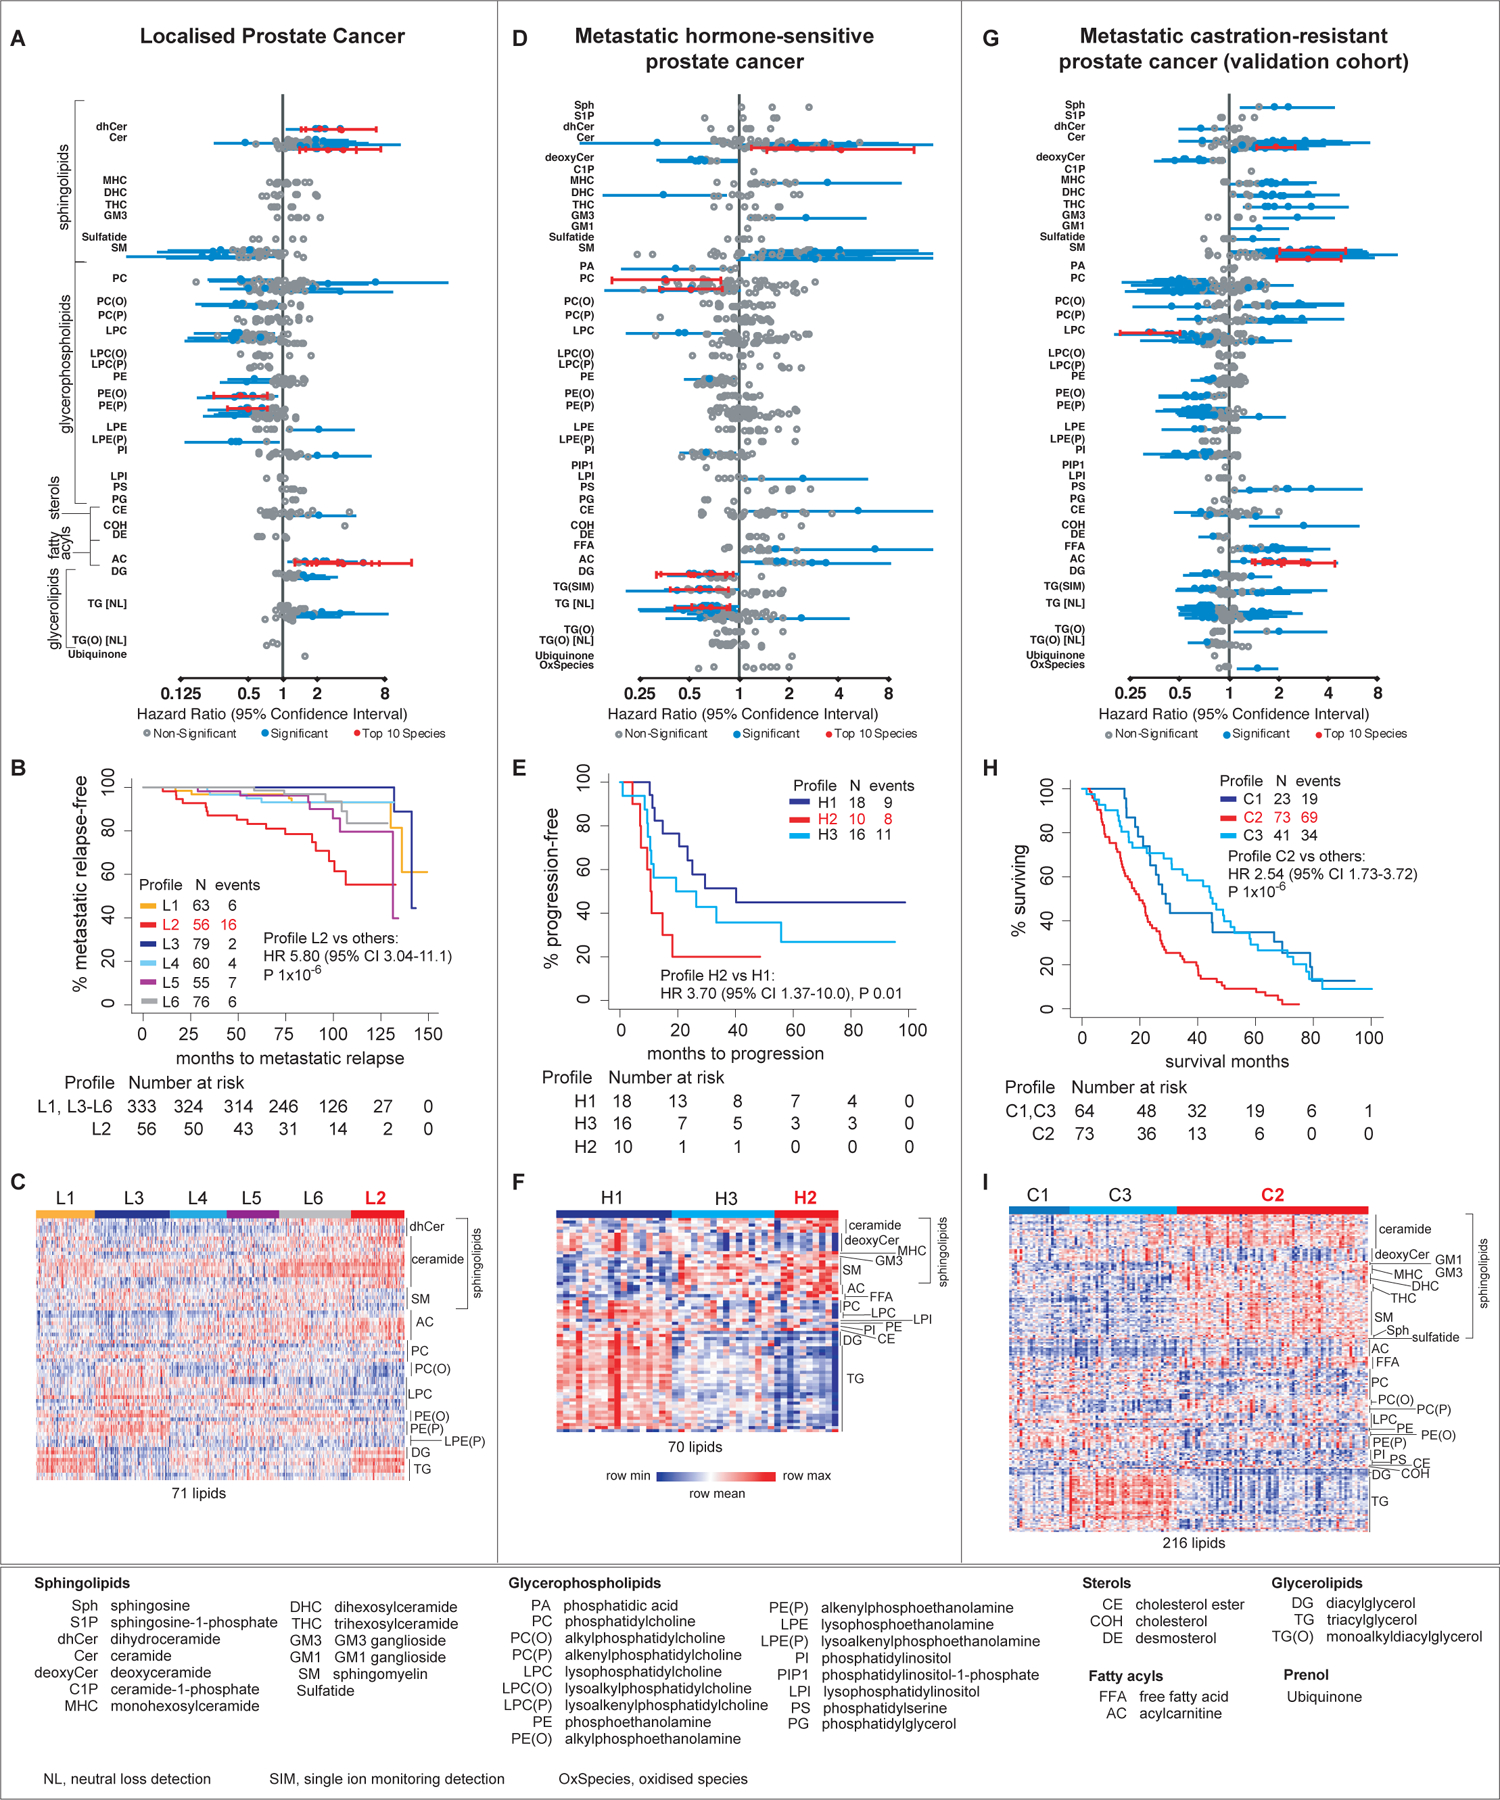
FIGURE 2. Association of plasma lipids with clinical outcomes in localised PC, mHSPC and mCRPC.

Forest plots of the hazard ratios of levels of plasma lipids (A,D,G); Kaplan-Meir curves (B,E,H) and heatmaps (C,F,I) of lipid profiles associated with clinical outcomes. The heatmaps show the levels of prognostic lipids that were significantly different between the profile with the worse outcome compared to the other profiles, except for mHSPC where the comparison is between Profile H2 and H1.
