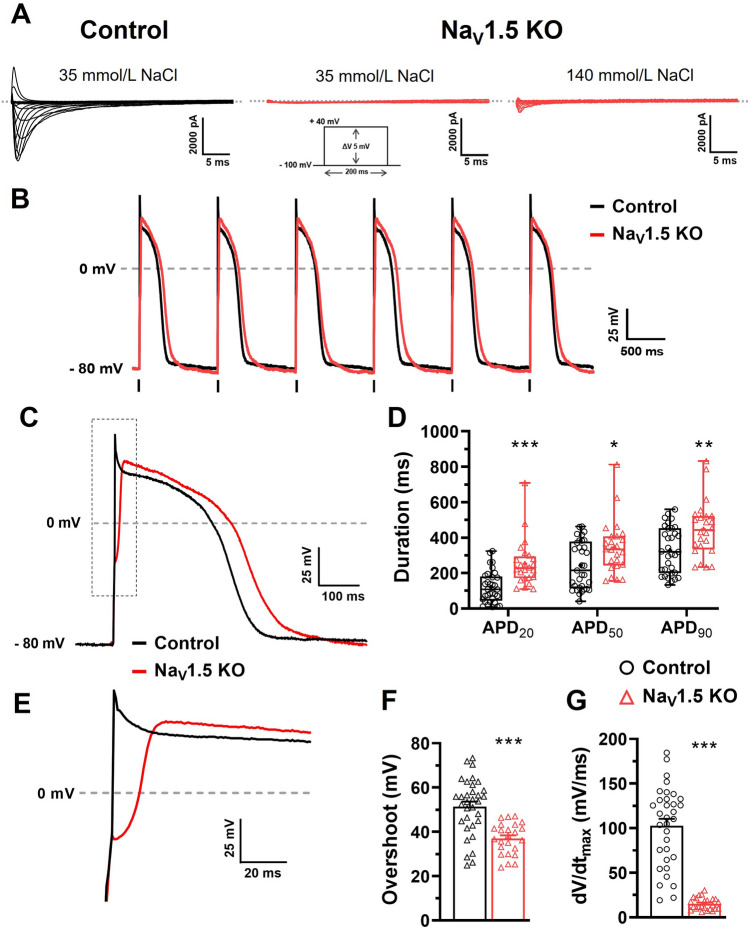
Figure 3.
Electrophysiological characterization of NaV1.5 KO iPSC-CMs. (A) Representative Na+ currents recorded in control and NaV1.5 KO iPSC-CMs with 35 or 140 mM NaCl in the external solution. The dashed line represents zero current. The currents were obtained using 200 ms pulses from − 100 to + 40 mV in + 5 mV increment. (B) Superposed train of APs from control and NaV1.5 KO at 1 Hz. Vertical bars at the bottom of the traces indicate the 3 ms stimulation pulse. (C) Close-up view of one AP showing the increase in the APD for NaV1.5 KO. (D) Box and whiskers summarizing the median (with quartiles and min to max values) of APD at 20 %, 50 %, or 90 % of repolarization at 1 Hz. *p < 0.05, **p < 0.01, ***p < 0.001 as determined using a nonparametric Mann–Whitney test. (E) Close-up view on the rising phase of representative APs traces. (F,G) Bar graphs showing the mean ± SEM of overshoot (F) and the maximal upstroke velocity (dV/dtmax) (G) of APs recorded at 1 Hz. ***p < 0.001 as determined using an unpaired t-test. Control n = 33 versus NaV1.5 KO n = 24. This figure was made using MICROSOFT POWERPOINT Version 2106 (build 14131.20278 Office, https://docs.microsoft.com/en-us/) and PRISM 8 Version 8.0.2 (263, https://www.graphpad.com/).

