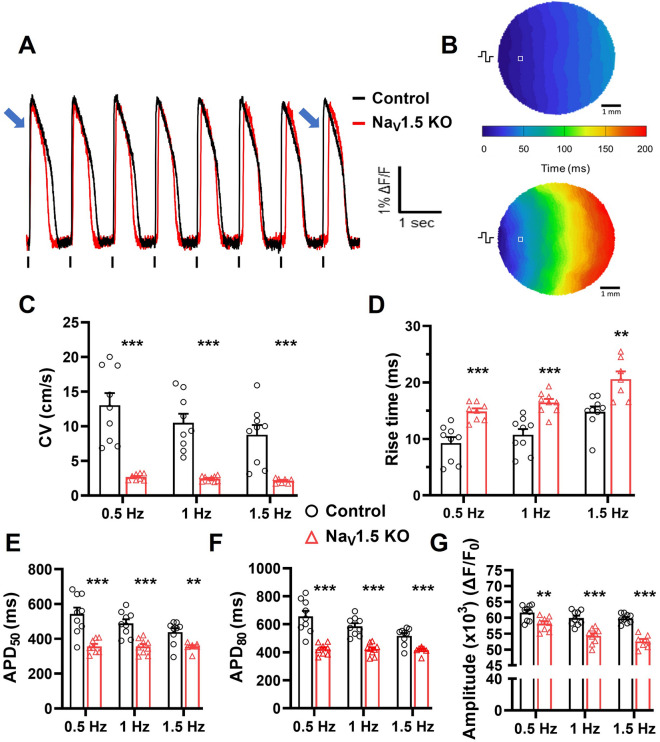
Figure 4.
Slower conduction velocity and altered OAP parameters in NaV1.5 KO iPSC-CMs. (A) Representative optical action potentials (OAPs) recorded in control and NaV1.5 KO iPSC-CMs monolayers using di-4-ANEPPS dye. Blue arrows at the beginning and at the end of the pulse train indicate the cumulative delay of OAPs activation in NaV1.5 KO recording. (B) Representative activation maps at a pacing of 1 Hz. The  symbol indicating the position of stimulating electrodes, and □ showing the position of the representative recordings. (C) Bar graphs summarizing the CVs, (D) the rise time, (E,F) action potential durations at 50 % or 80 % of repolarization and (G) the normalized amplitude of OAPs measured at stimulation frequencies of 0.5, 1 and 1.5 Hz in control (n = 9) and NaV1.5 KO (n = 7–9) iPSC-CM monolayers. Bars indicate SEM. **p < 0.01, ***p < 0.001 (control vs. NaV1.5 KO) as determined using unpaired t-test. A replicate (n) represents a single monolayer of iPSC-CMs on which optical mapping was performed. This figure was made using MICROSOFT POWERPOINT Version 2106 (build 14131.20278 Office, https://docs.microsoft.com/en-us/) and PRISM 8 Version 8.0.2 (263, https://www.graphpad.com/).

