Figure 5.
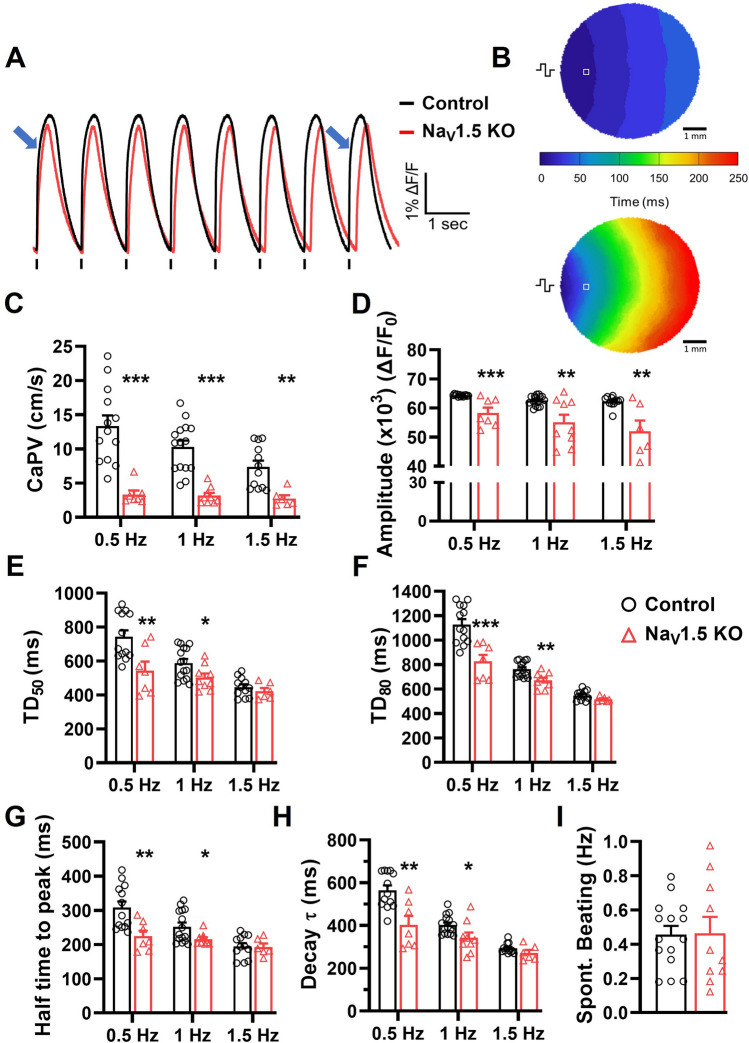
Altered calcium handling in NaV1.5 KO iPSC-CMs monolayers. (A) Representative Ca2+ transient traces of control and NaV1.5 KO iPSC-CMs monolayers. Blue arrows indicate the Ca2+ activation delay in NaV1.5 KO recording. (B) Representative  Ca2+ activation maps at pacing of 1 Hz. The symbol indicating the position of stimulating electrodes, and □ showing the position of the representative recordings. (C) Bar graphs summarizing the Ca2+ propagation velocities (CaPVs), (D) the normalized amplitude. (E,F) the Ca2+ transient durations at 50 and 80% of the repolarization phase (TD50 and TD80), (G) the half time to peak, and (H) the time constant of repolarization (Decay tau) measured at stimulation frequencies of 0.5, 1 and 1.5 Hz in control (n = 12–15) and NaV1.5 KO (n = 6–9). (I) Bar graphs showing the spontaneous Ca2+ waves frequencies in control (n = 15) and NaV1.5 KO (n = 10) iPSC-CM monolayers. A replicate (n) represents a single monolayer of iPSC-CMs on which the optical mapping was performed. Bars indicate SEM. *p < 0.05, **p < 0.001, ***p < 0.001 as determined by unpaired t-test. This figure was made using MICROSOFT POWERPOINT Version 2106 (build 14131.20278 Office, https://docs.microsoft.com/en-us/) and PRISM 8 Version 8.0.2 (263, https://www.graphpad.com/).

