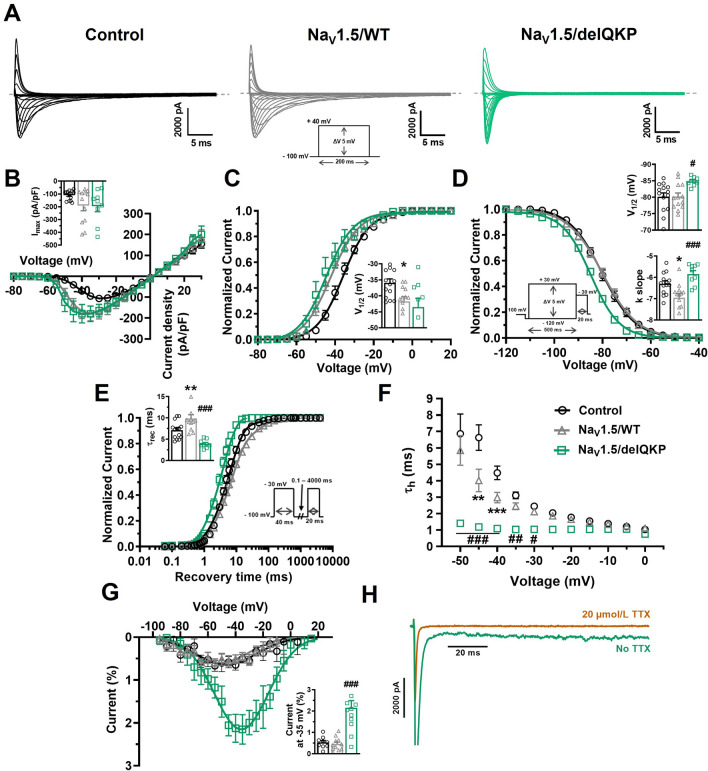
Figure 6.
Altered biophysical properties of Na+ channel in KO iPSC-CMs expressing NaV1.5/ΔQKP. (A) Representative Na+ currents recorded in control and KO iPSC-CMs transfected with NaV1.5/WT or NaV1.5/delQKP. The dashed line represents zero current. The currents were obtained using 200 ms pulses from − 100 to + 40 mV in + 5 mV increment. (B) Normalized intensity/voltage relationships (I/V) recorded in control (n = 14), NaV1.5/WT (n = 13) and NaV1.5/delQKP (n = 9) iPSC-CMs. Na+ current densities were measured by normalizing current amplitudes to membrane capacitance. Inset shows graph of Imax. (C) Steady-state activation of Na+ currents. Activation curves were generated using a standard Boltzmann distribution: G(V)/Gmax = 1/(1 + exp (− (V − V1/2)/k)). Inset shows graph of V1/2. (D) Steady-state inactivation of control (n = 14), NaV1.5/WT (n = 13) and NaV1.5/delQKP (n = 9). Inactivation currents were obtained using 20-ms test pulses to − 30 mV after a 500-ms pre-pulse to potentials ranging from − 120 to + 30 mV. The inactivation values were fitted to a standard Boltzmann equation: I(V)/Imax = 1/(1 + exp ((V − V1/2)/k)) + C. Inset shows graph of V1/2 and k slope (E) Recovery from inactivation values recorded from control (n = 14), NaV1.5/WT (n = 12) and NaV1.5/delQKP (n = 9) iPSC-CMs. The cells were depolarized to − 30 mV for 40 ms from a holding potential of − 100 mV to inactivate the Na+ channels. Test pulses were then applied at − 30 mV for 20 ms to measure current amplitudes, with an interval ranging from 0.1 to 4000 ms. The resulting curves were fitted with a simple exponential equation: (A (exp (− t/τ) + C). Inset shows a graph of the recovery time constant (τrec). (F) The time constants of fast inactivation decay were plotted as a function of voltage for control (n = 14), NaV1.5/WT (n = 13) and NaV1.5/delQKP (n = 9). The time constants were obtained using a simple exponential function. (G) Persistent Na+ current/voltage relationships recorded in control (n = 9), NaV1.5/WT (n = 11) and NaV1.5/delQKP (n = 12) iPSC-CMs. The currents were obtained using 300 ms pulses from − 100 to + 40 mV in + 5 mV increment. Persistent Na+ currents are represented as percentage of the current, obtained by normalizing the values at the end of the pulse to the maximum transient current. Inset shows graph of percentage of current at − 35 mV. (H) Representative persistent Na+ current at − 35 mV recorded in NaV1.5/delQKP iPSC-CMs before and after adding 20 µmol/L TTX. Bars indicate SEM. *p < 0.05, **p < 0.01 (control vs. NaV1.5/WT) and #p < 0.05, ##p < 0.01, ###p > 0.001 (NaV1.5/WT vs. NaV1.5/ΔQKP) using ANOVA and Dunnett’s post hoc tests. This figure was made using MICROSOFT POWERPOINT Version 2106 (build 14131.20278 Office, https://docs.microsoft.com/en-us/) and PRISM 8 Version 8.0.2 (263, https://www.graphpad.com/).

