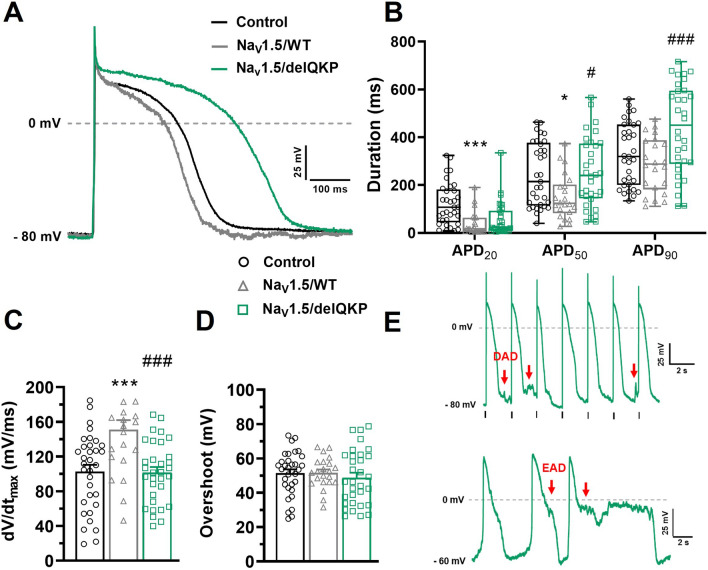
Figure 7.
APD prolongation, dV/dt affected and arrhythmogenic events in KO iPSC-CMs expressing NaV1.5/delQKP. (A) Representative APs traces at a stimulation frequency of 1 Hz recorded in control and KO iPSC-CMs transfected with NaV1.5/WT or NaV1.5/delQKP. (B) Box and whiskers summarizing the median (with quartiles and min to max values) of APD at 20%, 50%, or 90% of repolarization at 1 Hz. *p < 0.05, ***p < 0.001: control versus NaV1.5/WT; #p < 0.05, ###p < 0.001: NaV1.5/WT versus NaV1.5/delQKP. A nonparametric Kruskal–Wallis test was performed. (C,D) Bar graph showing the mean ± SEM of the dV/dtmax (C) and the overshoot of APs (D) recorded at 1 Hz. ***p < 0.001: control versus NaV1.5/WT; ###p < 0.001: NaV1.5/WT versus NaV1.5/delQKP. Significance was determined by ANOVA and Dunnett’s post hoc tests. (E) Examples of DAD (red arrows) recorded at a stimulation of 0.5 Hz and EAD (red arrows) recorded in spontaneous AP (gap-free mode) in NaV1.5/delQKP. Control n = 33, NaV1.5/WT n = 22 and NaV1.5/delQKP n = 32. This figure was made using MICROSOFT POWERPOINT Version 2106 (build 14131.20278 Office, https://docs.microsoft.com/en-us/) and PRISM 8 Version 8.0.2 (263, https://www.graphpad.com/).

