
Figure 4. The prg-1(−) mutant alters levels of small RNAs corresponding to many loci.
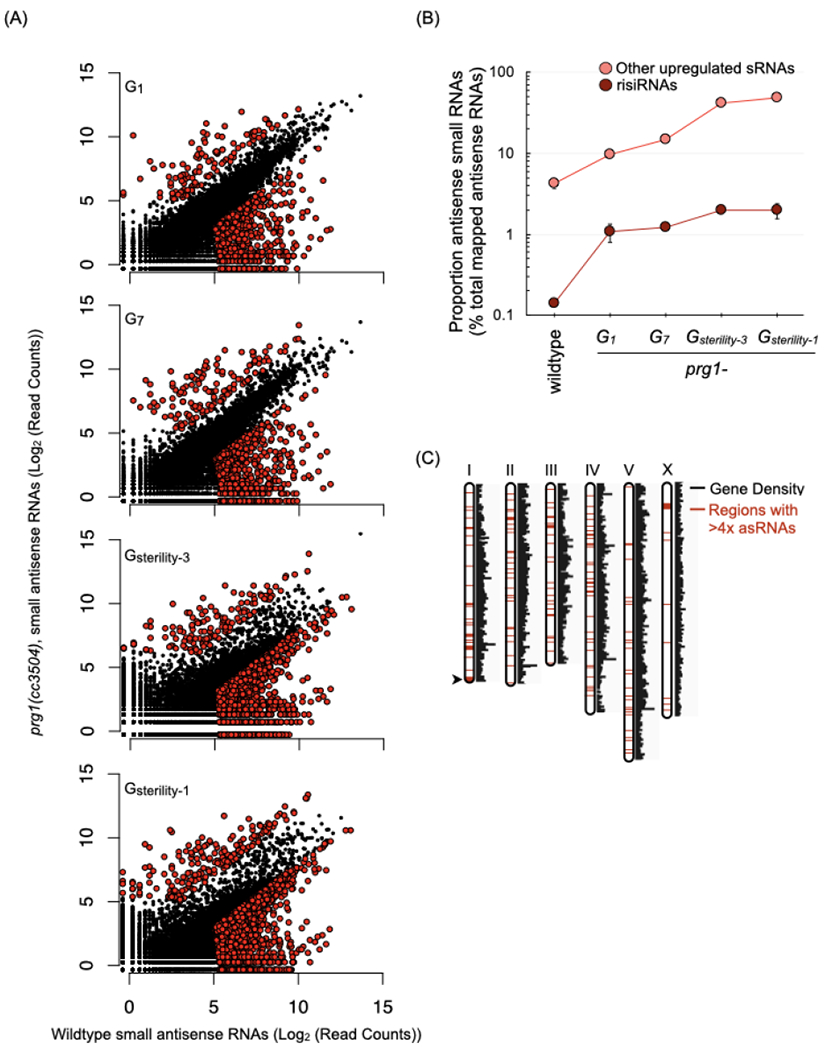
(A) Scatterplots depict antisense small RNAs per gene in young adult prg-1(−) animals at various generations, relative to small RNAs per gene in wildtype animals. Counts are per 106 reads mapped to the ce11 genome and represent the mean of two biological replicates. Colored dots indicate genes meeting three criteria: (i) an aggregate small RNA count for the two samples > 50, (ii) a raw fold change of > 4-fold relative to wildtype, and (iii) passed a Bayesian maximum likelihood filter using a cutoff FDR (False Discovery Ratio) of 0.05 per gene. Generations assayed are indicated as followed: number of generations (n) since start of the transgenerational fertility assay (Gn), the generation of sterility (Gsterility), and number of generations (n) prior to complete sterility (Gsterility-n). The two prg-1(−) replicates used here went sterile at G17 and G18. Number of genes with > 4-fold and < 4-fold small RNAs in the various generations: G1= 114 and 705, G7= 137 and 781, Gsterility-3= 131 and 2108, and Gsterility-1= 201 and 2341.
See also Figure S4A–D.
(B) Proportion of antisense ribosomal RNAs (risiRNAs) and the remaining subset of up-regulated small RNAs from the prg-1(−) Gsterility-3 generation (n=197) in wildtype and across generations in prg-1(−). Values are the mean of two biological replicates, represented as a proportion of mapped antisense RNAs. Error bars represent standard error of the mean. (C) Genomic distribution of loci with> 4-fold increase of small RNAs in Gsterility-1 prg-1(−) relative to wildtype. Red regions indicate locations of genes with upregulated small RNAs.
See also Figure S4E and Table S1.