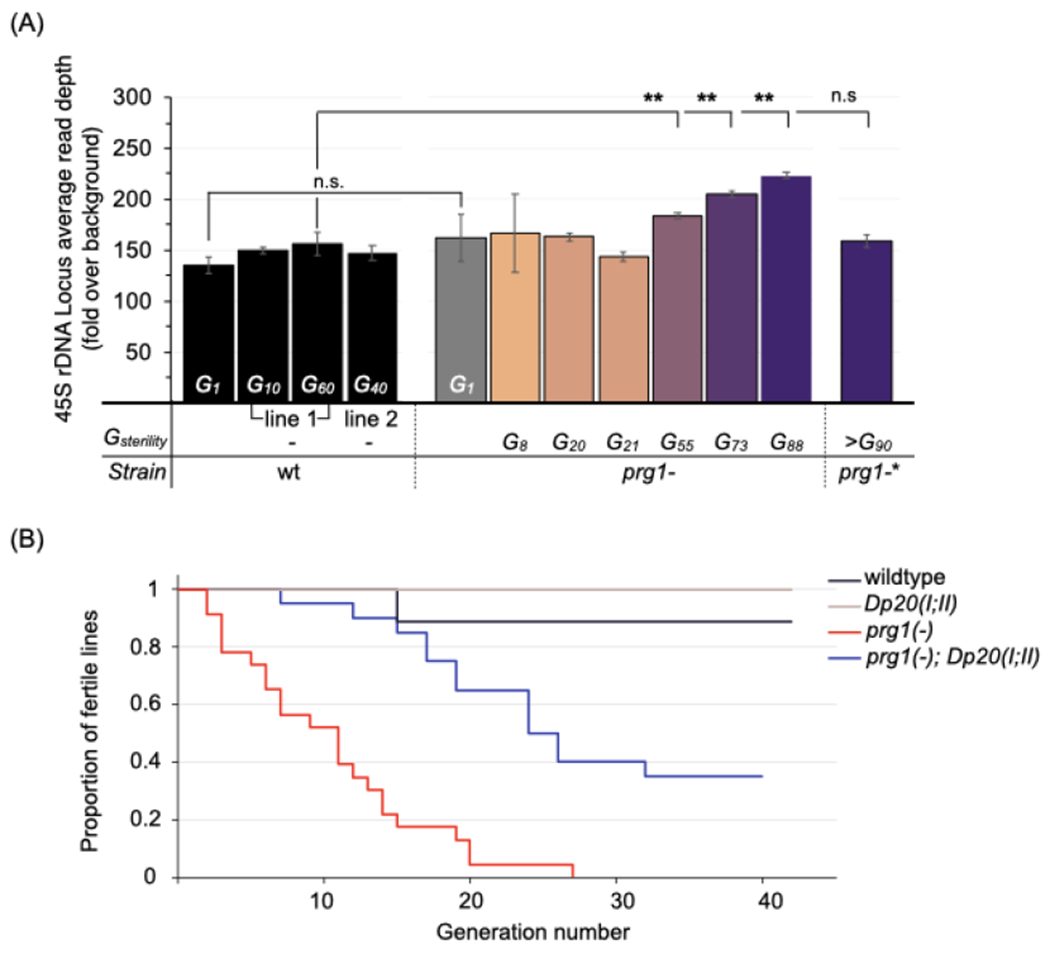
Figure 6. rDNA copy number increases prolong the transgenerational lifespan of prg-1(−).

(A) Relative copy number of the 45S rDNA locus in wildtype and prg-1(−) animals. Values represent mean read depths across the rDNA locus relative to genome-wide obtained from single-worm genome sequencing (n=3-5 animals each). Wildtype animals were sequenced at generations 1, 10, 60 and 40 from the start of the transgenerational fertility assay. Prg-1(−) animals were sequenced at generation 1, or within two generations of the indicated generation of sterility (Gsterility). Error bars represent standard error of the mean. The prg-1(−)* line contains a spontaneous transposon insertion in dcr-1; the region is depicted in Figure S6C. Statistics: Student’s t-test (**p<.01).
See also Figure S6A–D.
(B) Proportion of fertile prg-1(−) lines with additional rDNA copies introduced. Kaplan-Meier plot for prg-1(−) animals with (blue line, n=20) and without (red line, n=23) a duplication of the 45S rDNA locus (Dp20(I;II)), and control wildtype (black line, n=10) and Dp20(I;II) (beige line, n=10) animals. Statistics: Log-rank test (***p <001 for prg-1(−) versus prg-1(−);Dp20(I;II)).
See also Figure S6E–G.
