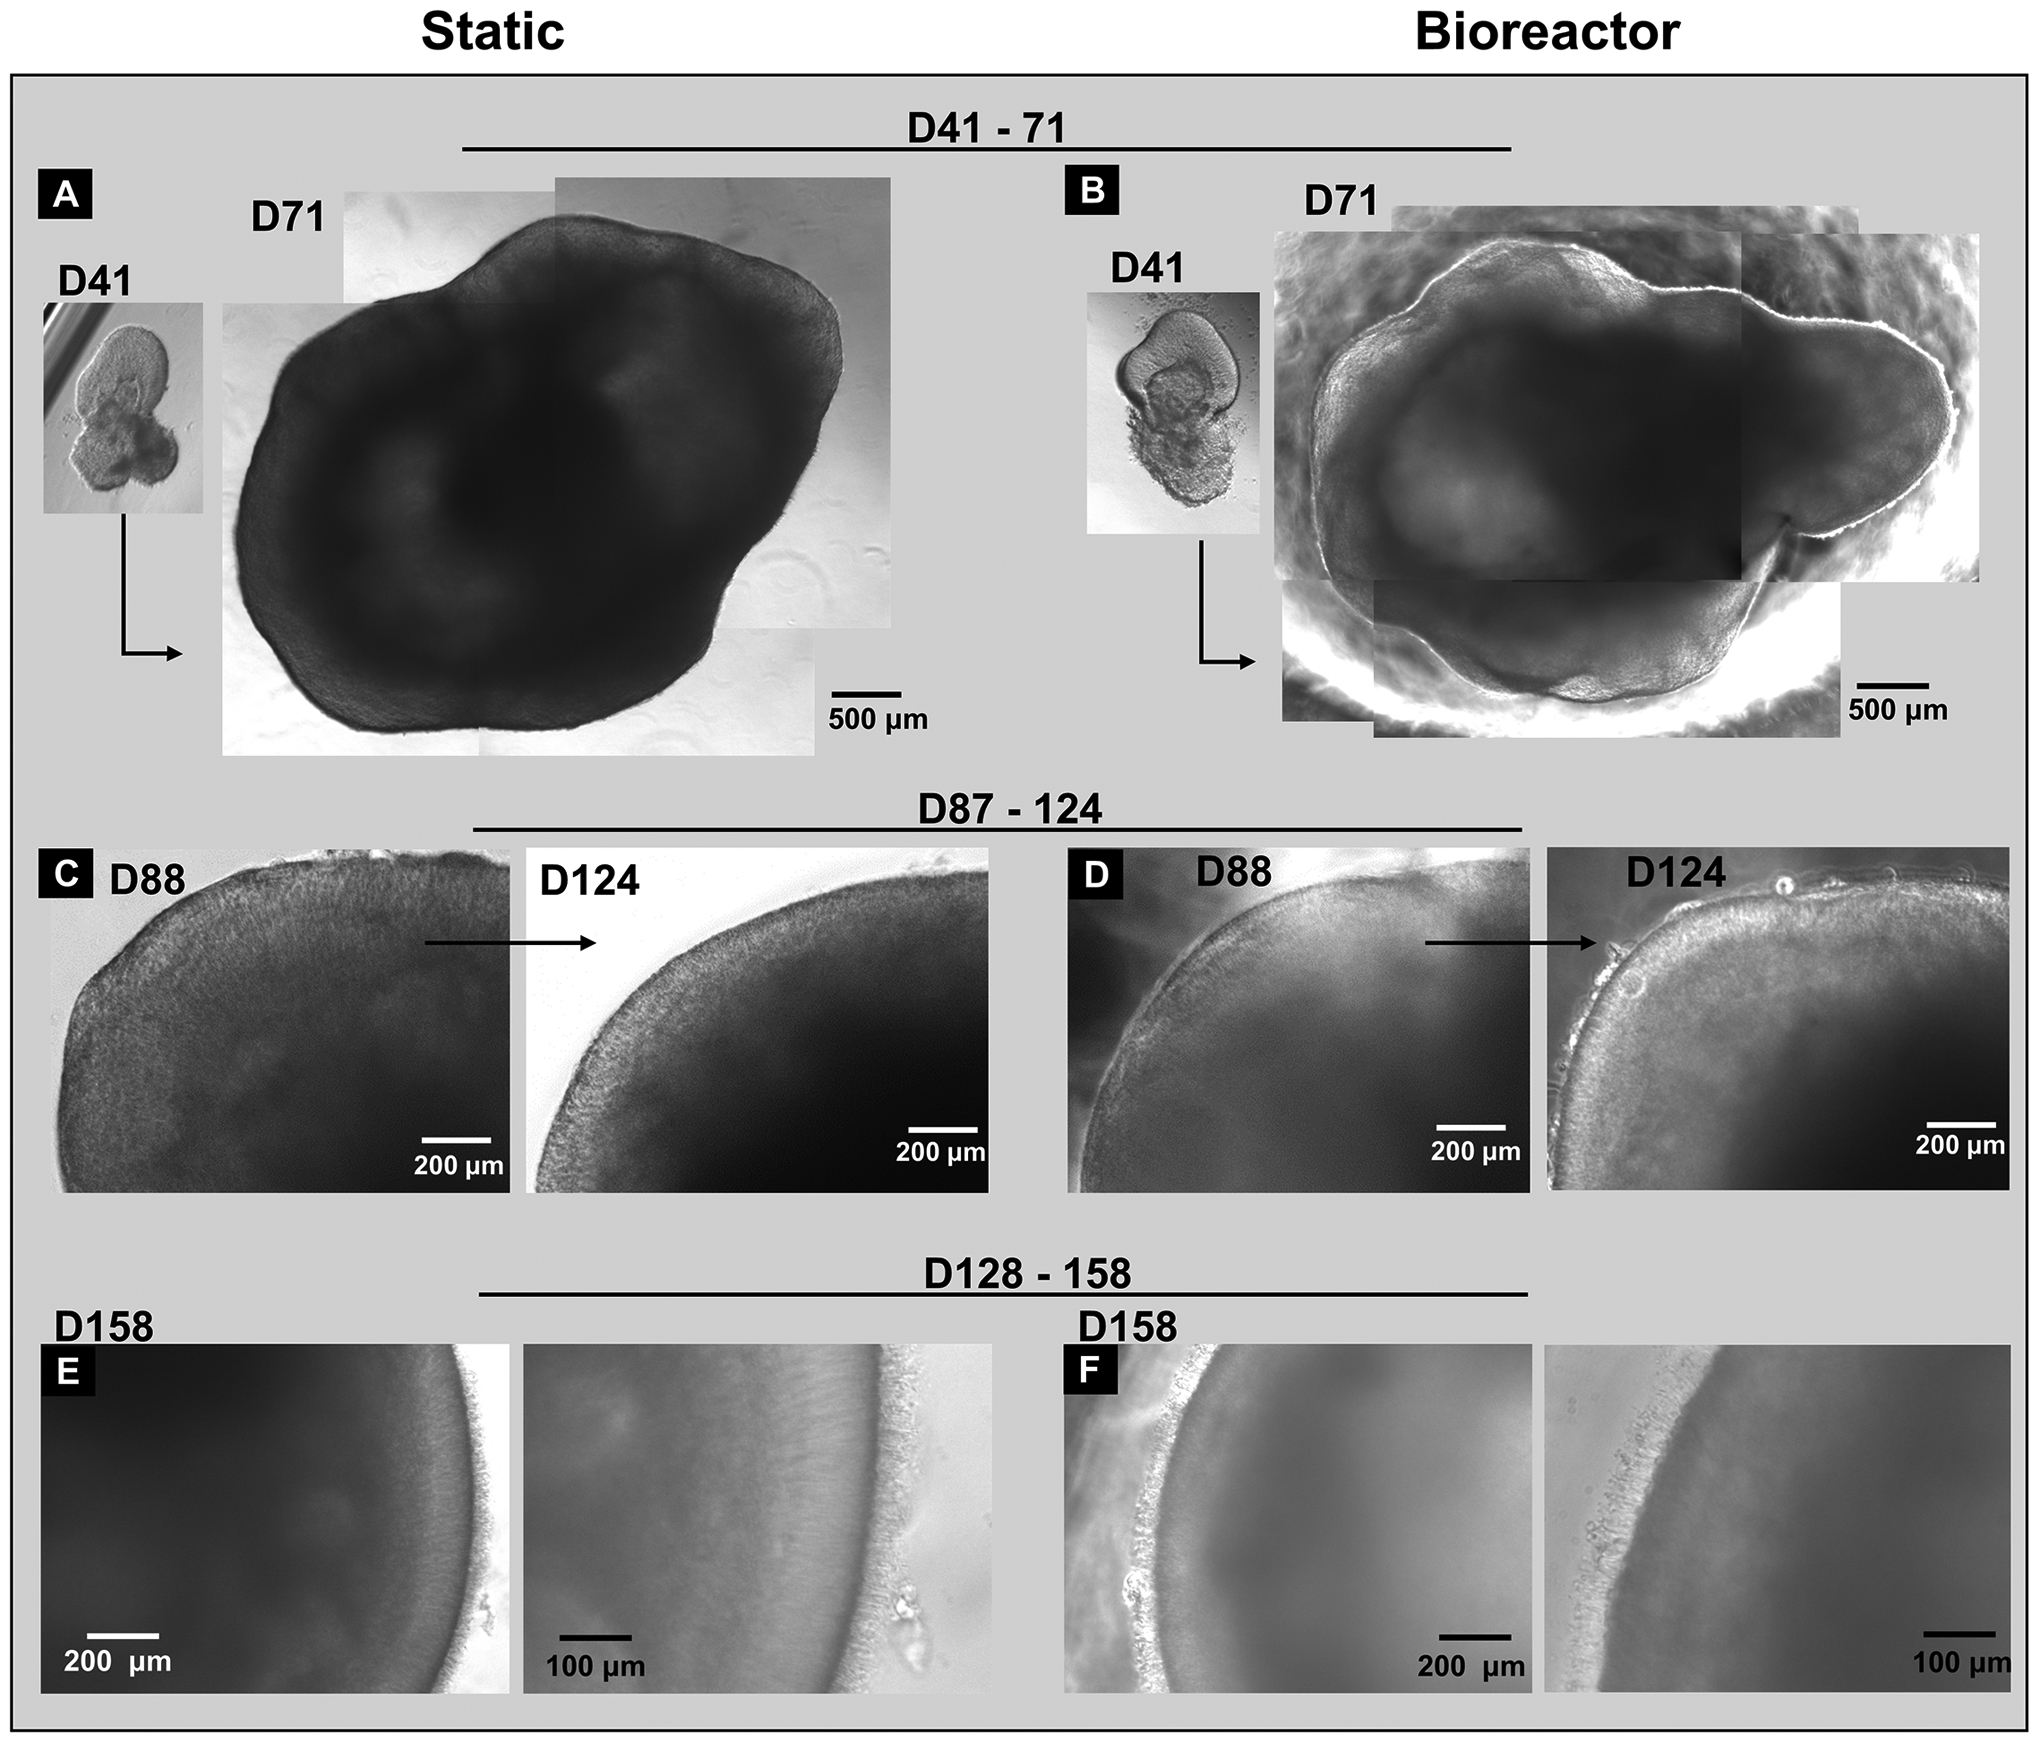
Figure 4: Representative phase contrast images of organoid differentiation in bioreactors and static culture during different stages of development.

The same RtOg in static culture (A) and bioreactor culture (B) from day 41 to 71 demonstrating the magnitude of RtOg growth (Day 41 insets share the same 500 μm scale bar as Day 71 larger insets); (C) The same RtOg in static culture from day 88 to 124; (D) The same RtOg in bioreactor culture from day 88 to 124; (E-F) RtOgs on day 158 of differentiation showed outer segment structures in both static and bioreactor groups. (C-F) Higher magnification figures were shown on the right.
