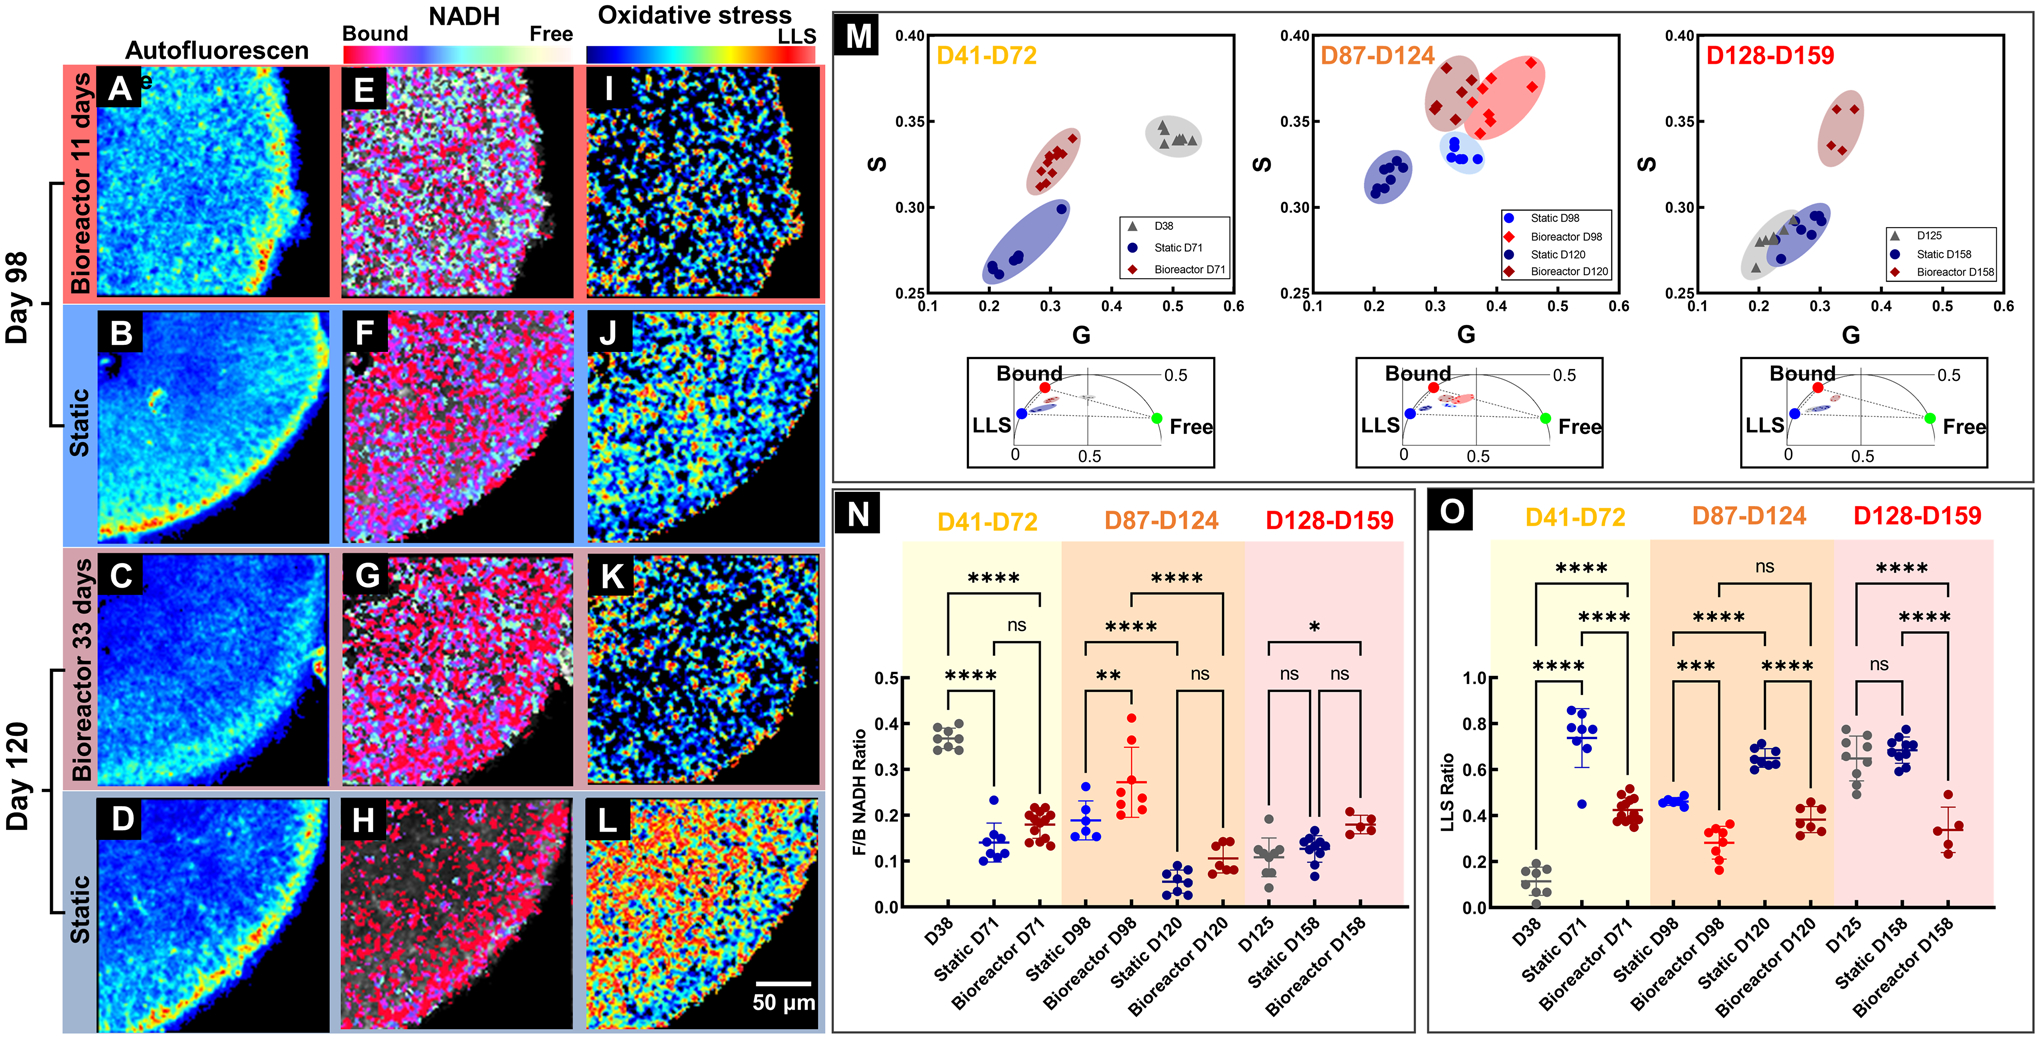
Figure 5: Qualitative and quantitative comparison of RtOgs in two culture methods.

(A-D) Total NADH autofluorescence images demonstrated the cellular structures within RtOg cross sections; Pseudo color-coded free/bound NADH distribution (E-H) and LLS distribution (I-L) images were generated based on two photon lifetime within the 2-dimensional phasor space; (M) Scatter plots of and the clustering of different groups of RtOgs on the FLIM phasor diagram; (N) Plot of free/bound NADH ratio to evaluate metabolism (higher f/b value represented glycolysis, and lower f/b indicated greater oxidative phosphorylation.) Metabolism is not significantly different between static and bioreactor RtOgs after 1 month in culture for RtOgs of different ages; (O) Plot of LLS ratio to evaluate oxidative stress. LLS is significantly different between static and bioreactor maintained RtOgs of different ages after 1 month in culture. The values of f/b NADH ratio and LLS ratio reflect the average lifetimes of the organoids cross-section imaging frame. (One-way ANOVA test was performed: D38, n = 8; Static D71, n = 8; Bioreactor D71, n = 13; Static D98, n = 6; Bioreactor D98, n = 8; Static D120 n = 8; Bioreactor D120, n = 7; D125, n = 9; Static D158, n = 10; Bioreactor D158, n = 4; The RtOgs placed into the bioreactor D41–72 were imaged on D38 at the outset of the experiment. The RtOgs placed into the bioreactor D128–159 were imaged on D125 at the outset of the experiment.)
