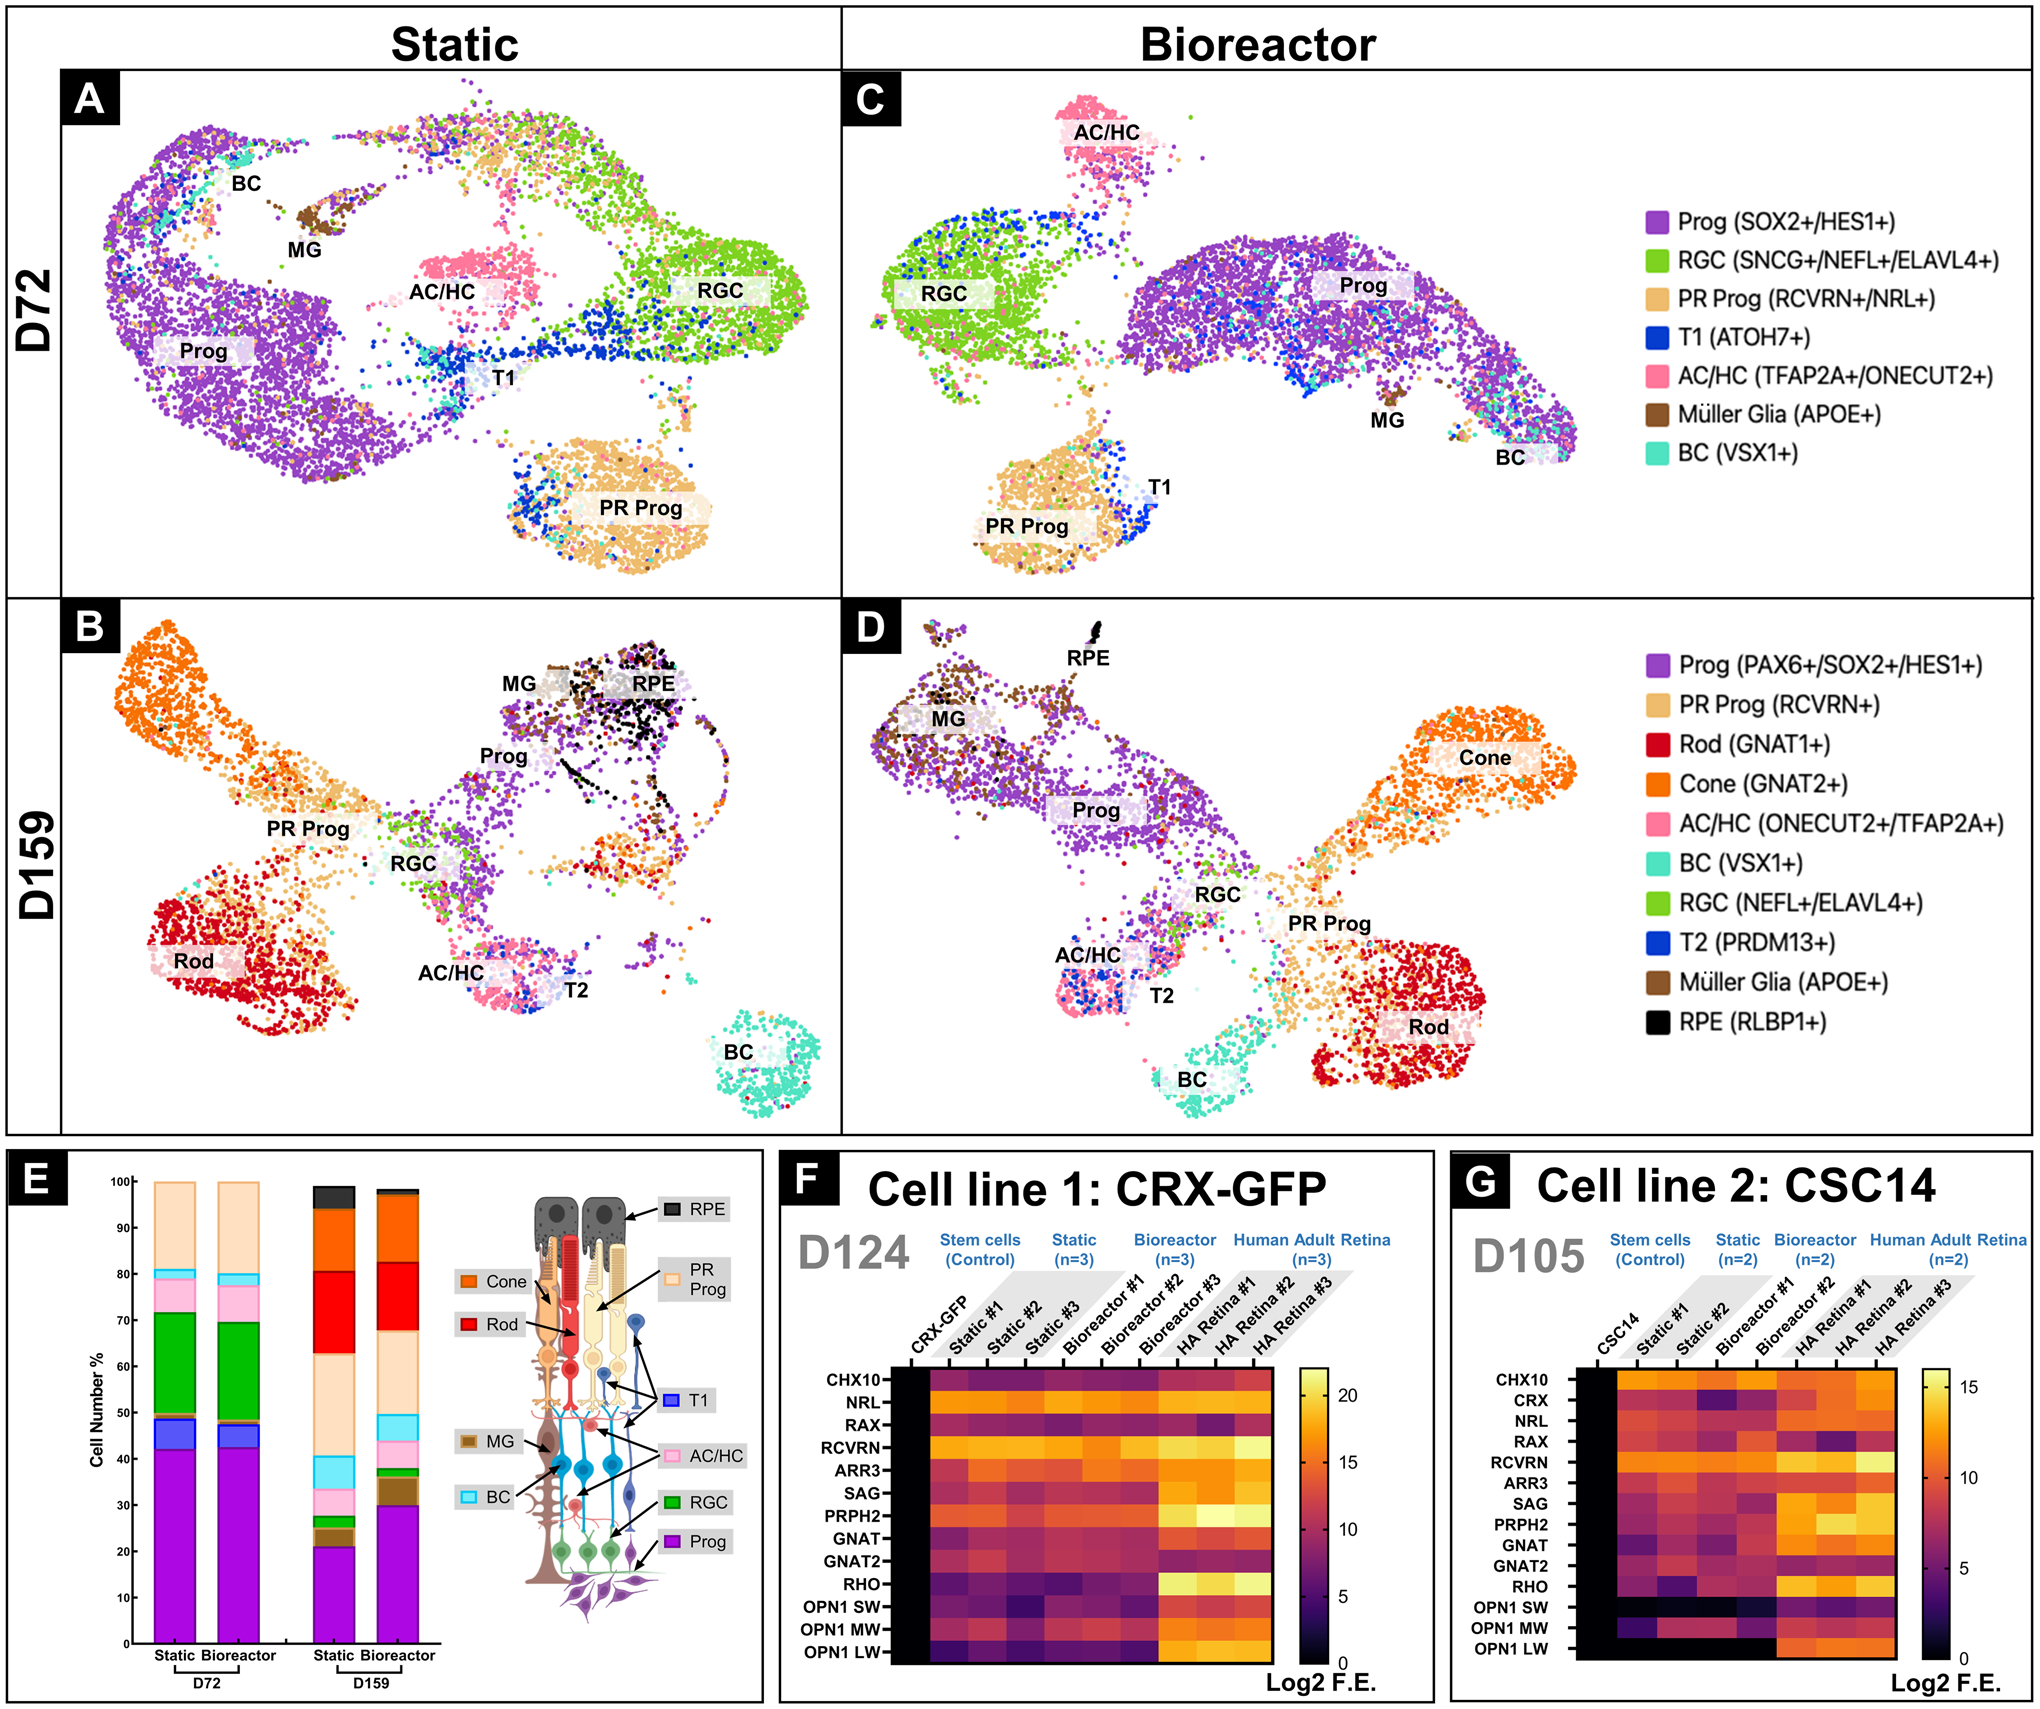
Figure 6: Gene profiles of RtOgs at different ages.

Single-cell RNA seq generated UMAP identified cell types of RtOgs cultured under static on day 72 (A) and day 159 (B),under bioreactor culture on day 72 (C) and day 159 (D); (E) Cell number quantification: Cell number percentage of different type of cells, organized by the order of photoreceptor layers and the schematic image was shown on the right side; (F) qPCR gene analysis of CRX-GFP hESCs (negative control) generated RtOgs on day 124 of differentiation; (G) qPCR gene analysis of CSC-14 hESCs (negative control) generated RtOgs on day 105 of differentiation; Log2 F.E – Log2 (Fold Expression); Cell identities in (A-E): Prog – retinal progenitor cell; RGC – retinal ganglion cell; PR prog – photoreceptor progenitor cell; T1 – transition phase 1; AC/HC – amacrine cells and horizontal cells; BC – bipolar cells; T2 – transition phase 2; RPE – retinal pigment epithelium cell.
