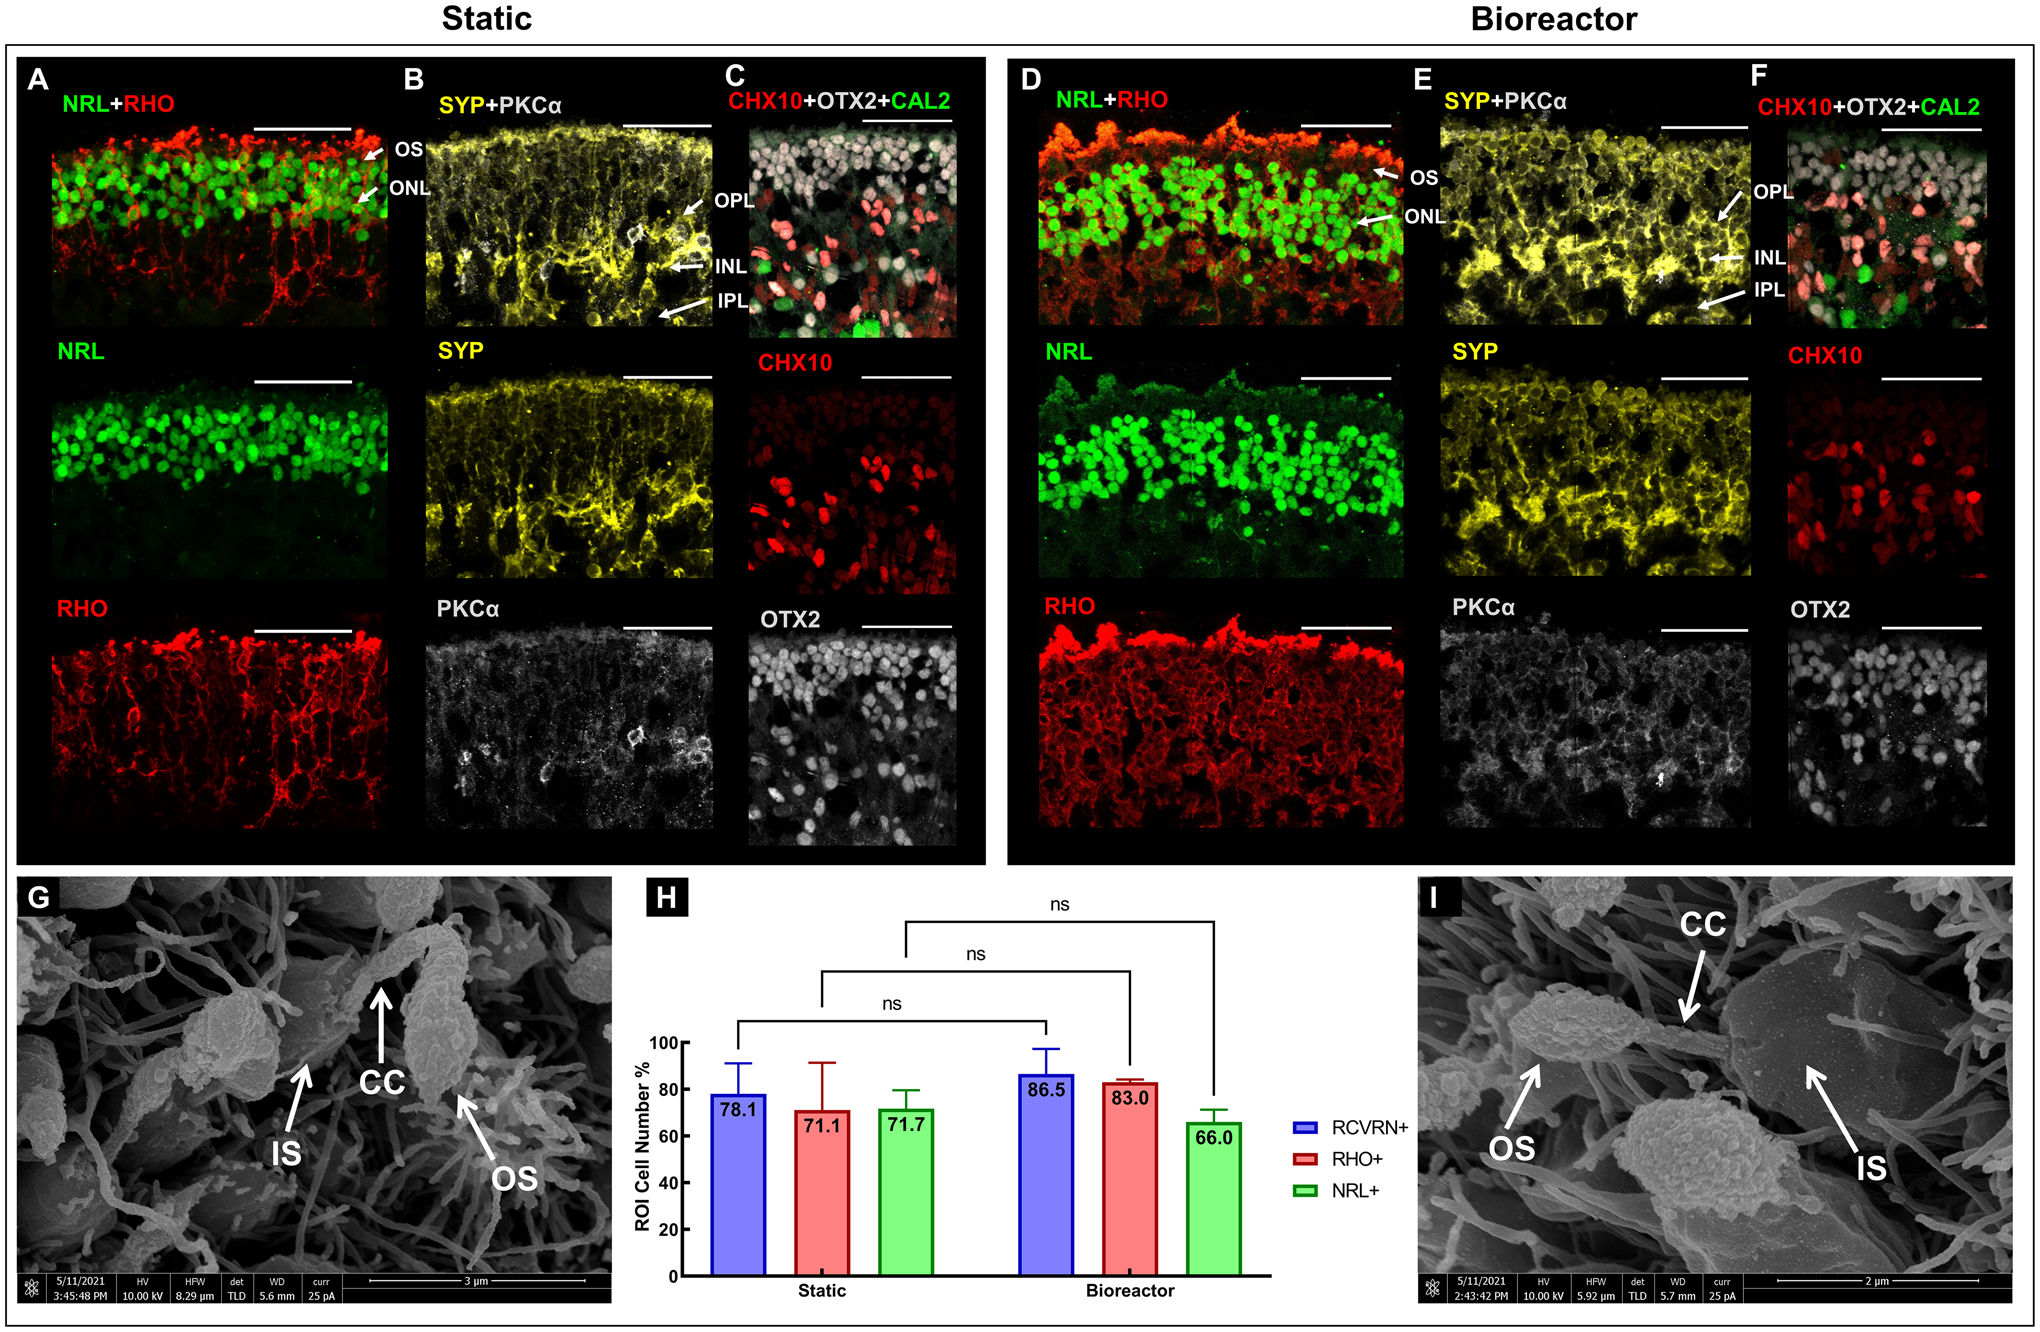
Figure 8: Immunohistology and SEM images of RtOgs on day 159 of differentiation.

Immunostaining images of static (A-C) and bioreactor (D-F) cultured RtOgs. SEM images of static (G) and bioreactor (I) cultured RtOgs; (H) Cell counting from selected immunohistology slides (RCVRN+: nstatic = 2, nbioreactor = 3; RHO+: nstatic = 3, nbioreactor = 3; NRL+: nstatic = 3, nbioreactor = 3). Antibody marked cells: RHO – rod photoreceptors; NRL – photoreceptors; CHX10 – retinal progenitor cells; OTX2 – photoreceptor progenitor cells; CAL2 – amacrine cells; SYP – synaptophysin; PKCα – rod bipolar cells. Arrow markers: OS – outer segment; IS – inner segment; CC – connection cilium. ONL – outer nuclear layer; OPL – outer plexiform layer; INL – inner nuclear layer; IPL – inner plexiform layer. (scale bar: 50 μm)
