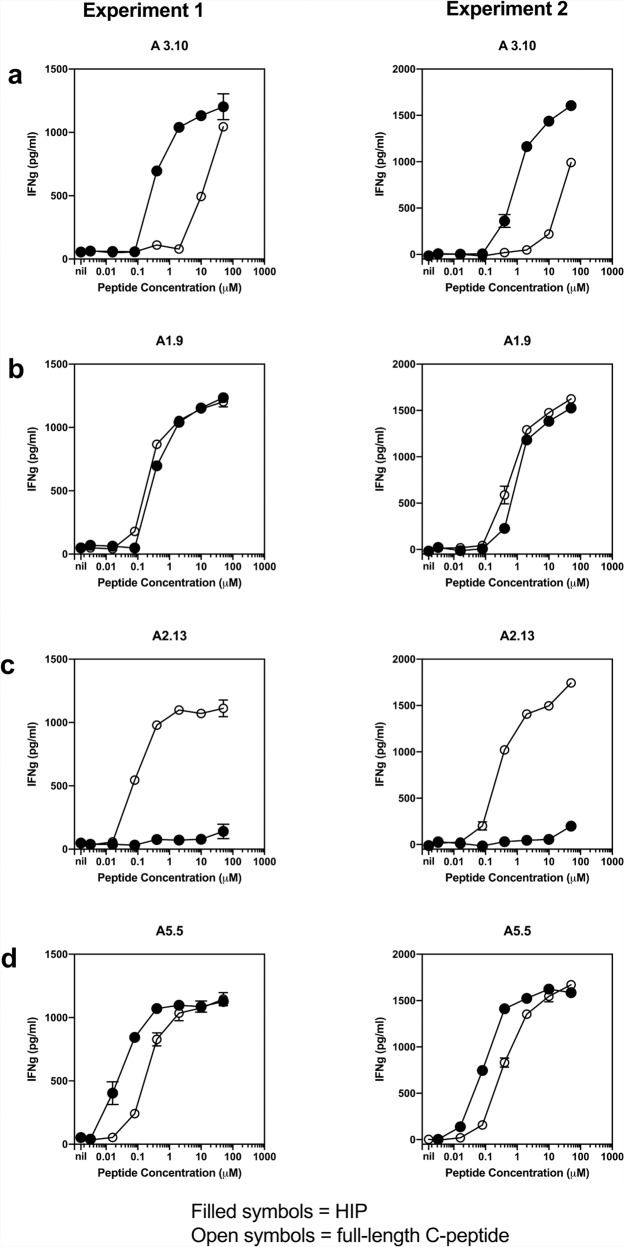
Fig. 2. Comparison of the stimulatory capacity of full-length proinsulin C-peptide and HIP on T1D CD4 + T cell clones.
A different clone is shown in each panel, clone A3.10 (a), clone A1.9 (b), clone A2.13 (c), clone A5.5 (d). Titration of full-length 31-mer C-peptide (EAEDLQVGQVELGGGPGAGSLQPLALEGSLQ, (open circles) and 15mer C-peptide-IAPP2 HIP (GQVELGGGNAVEVLK (filled circles). Antigen presenting cells (APC) were the EBV line, EBV-KJ, (2 × 10⁴ cells/well). APC were cultured for 24 h with the same number (2 × 10⁴ cells/well) of the primary CD4 + T-cell clone and the peptide concentration indicated. T-cell response to peptide were indicated by secretion of IFNγ which was measured in triplicate by ELISA and reported as pg/ml. Mean and standard deviations of triplicate IFNγ measurements are shown. Results are representative of two experiments for each clone.

