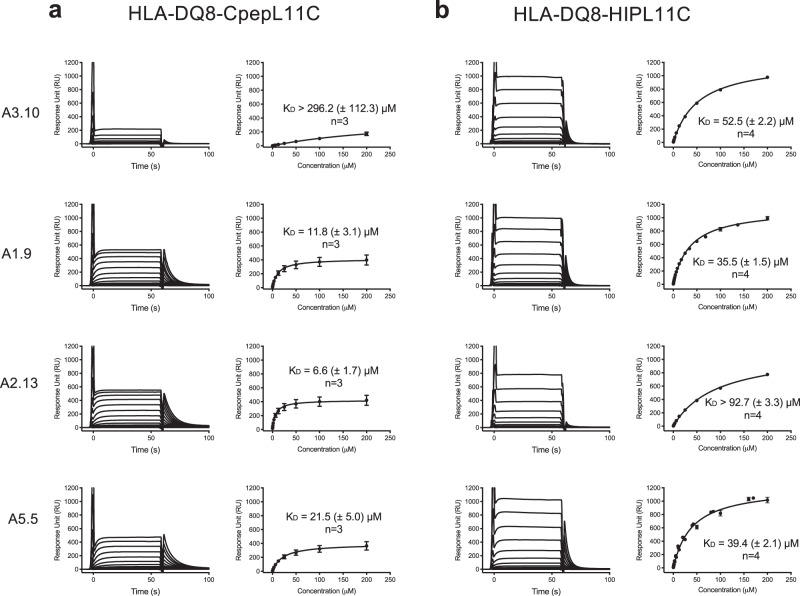
Fig. 3. Affinity determination for the HLA-DQ8-CpepL11C/HIPL11C restricted TCRs.
Binding analysis of TCRs A3.10, A1.9, A2.13, and A5.5 for a HLA-DQ8-CpepL11C and b HLA-DQ8-HIPL11C was determined using SPR. A concentration series from 200 μM to 0 μM of each TCR was passed over surface immobilised a HLA-DQ8-CpepL11C and b HLA-DQ8-HIPL11C. Left columns in a and b: measured response curves of the single dilution series for each TCR. Right columns in a and b: Curve fits for TCR-HLA-DQ8-CpepL11C/HIPL11C and KD determination using single ligand binding model. Each TCR sample was analysed in duplicate, and three (n = 3) or four (n = 4) (as indicated) independent experiments were conducted and measurements were combined after normalising each equilibrium response curve against the calculated response maximum. Data are mean ± standard error, s.e.m. Source data are provided as a Source Data file.

