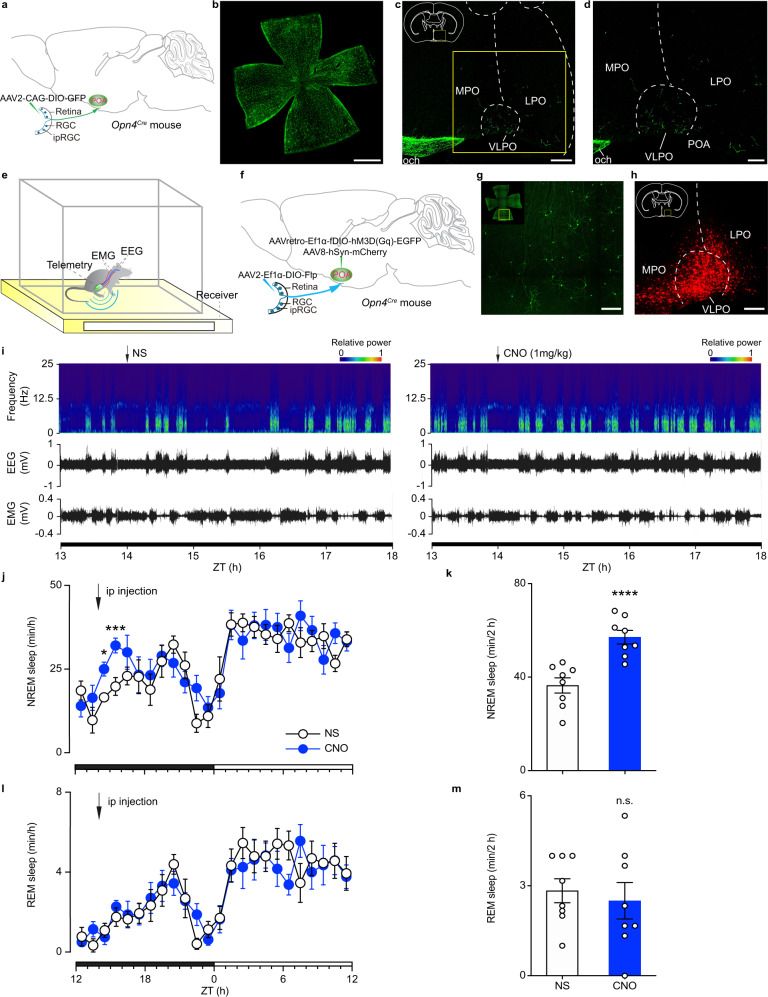
Fig. 1. Activation of ipRGC-POA circuit induced NREM sleep but not REM sleep.
a Schematic of intravitreal virus injection. b, c Immunostaining of GFP in the retina (n = 10 retinas from 5 animals; Scale bar, 1000 μm) (b), the MPO, the LPO, and the VLPO (n = 5; scale bar, 200 μm) (c). The boxed region in c is enlarged in d (n = 10 retinas from 5 animals; scale bar, 100 μm). e Schematic showing electroencephalogram (EEG)/ electromyogram (EMG) wireless recording. f Schematic of dual injection strategy showing intravitreal and brain virus injections. g Immunostaining of EGFP in the retina (n = 16 retinas from 8 animals; scale bar, 200 μm). h Immunostaining of mCherry in the POA (n = 8 animals; scale bar, 200 μm). i Typical examples of relative EEG power (normalized by the highest power in each frequency band) and EEG/EMG traces over 4 h following normal saline (NS) injection (left) or clozapine-N-oxide (CNO) injection (right) at zeitgeber time (ZT) 14. j Time course changes in NREM sleep after NS or CNO injection (n = 8 animals; two-way ANOVA (ZT 14 to ZT 16), F1, 14 = 22.45, P = 0.0003, Bonferroni post hoc test, *P < 0.05, ***P < 0.001). Each cycle represents the hourly mean ± SEM of sleep. The black and white bars on the x axes indicate light-off and light-on periods, respectively. k, Total time sleep in NREM sleep for 2 h after NS or CNO injection (n = 8 animals; two-tailed Student’s t-test, t7 = 8.379, P = 0.000068, ****P < 0.0001). l Time course changes in REM sleep after NS or CNO injection (n = 8 animals; two-way ANOVA, F1, 14 = 0.0821, P = 0.7786, Bonferroni post hoc test). m Total time sleep in REM sleep for 2 h after NS or CNO injection (n = 8 animals; two-tailed Student’s t test, t7 = 0.8913, P = 0.4024). All error bars denote SEM. ipRGC, intrinsically photosensitive retinal ganglion cell; MPO, medial preoptic area; LPO, lateral preoptic area; VLPO, ventrolateral preoptic nucleus; och, optic chiasm; n.s., non-significant; NREM, non-rapid eye movement.

