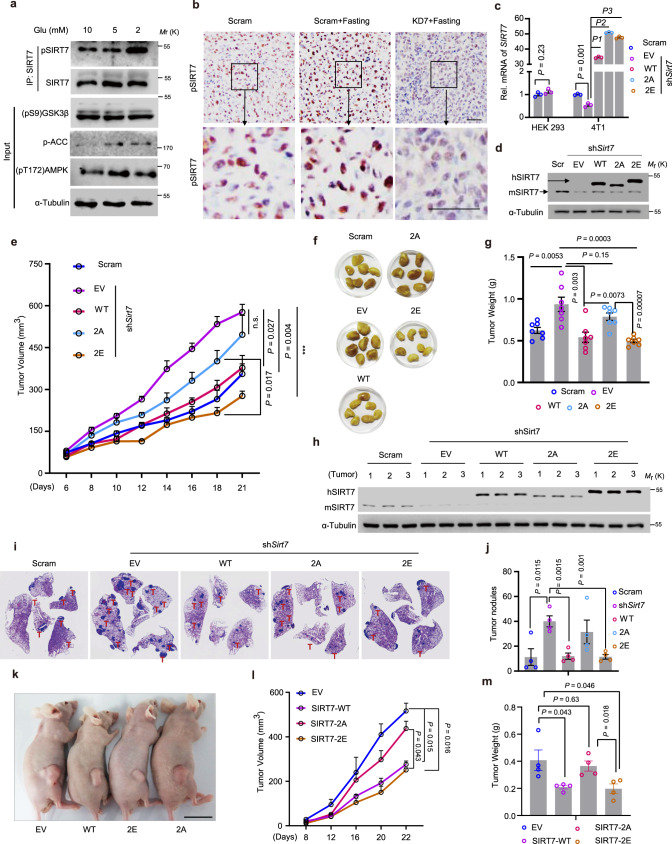
Fig. 4. The GSK3β–SIRT7 axis underlies the anti-tumor effects of fasting.
a Immunoblotting analysis of SIRT7 phosphorylation (p-SIRT7) levels in 4T1 murine mammary tumor cells cultured with different concentrations of glucose (Glu). b Representative images of IHC staining showing p-SIRT7 levels in isolated tumor samples (related to Fig. 1g, n = 3 mice for analysis per group); scale bar, 50 µm. c, d Quantitative PCR (c, n = 3 biologically independent samples) and immunoblots (d) showing the expression of hSIRT7 WT and indicated mutants in 4T1 cells in which endogenous mSirt7 was knocked down by shSirt7. HEK293 cells were transfected with shSirt7 to confirm the species specificity of shRNA. EV empty vector, WT human SIRT7-WT, 2A human SIRT7-2A, 2E human SIRT7-2E. e 4T1 cells prepared in (c) were injected into the mammary fat pad of female Balb/c mice (n = 7 per group). Tumor size was measured using Vernier calipers. f, g Images showing tumor xenografts isolated from (e) at the end of experiment and tumor weight (g). h Immunoblotting analysis of SIRT7 expression in tumor samples extracted from (e). i, j Representative images showing lung metastatic tumor nodules in mice (n = 4 mice per group) injected with 4T1 cells as described in (c). Lung metastasized tumor nodules counted from whole-lung sections after H&E staining are shown in (j). k–m Representative images (k), tumor growth rate (l), and average tumor weight (m) of H1975 lung cancer cells expressing EV, SIRT7-WT, SIRT7-2A, or SIRT7-2E following inoculation of nude mice with cancer cells (n = 4 mice per group). Data represent means ± SEM (c, e, g, j, l, m). P values were determined by two-tailed Student’s t-test (c, g, j, m) or two-way ANOVA analysis (e, l), ***P = 0.00003, P1 = 0.00000004, P2 = 0.0000000024, P3 = 0.000000031. Representative results were analyzed from at least three independent experiments. Source data are provided as a Source Data file.

