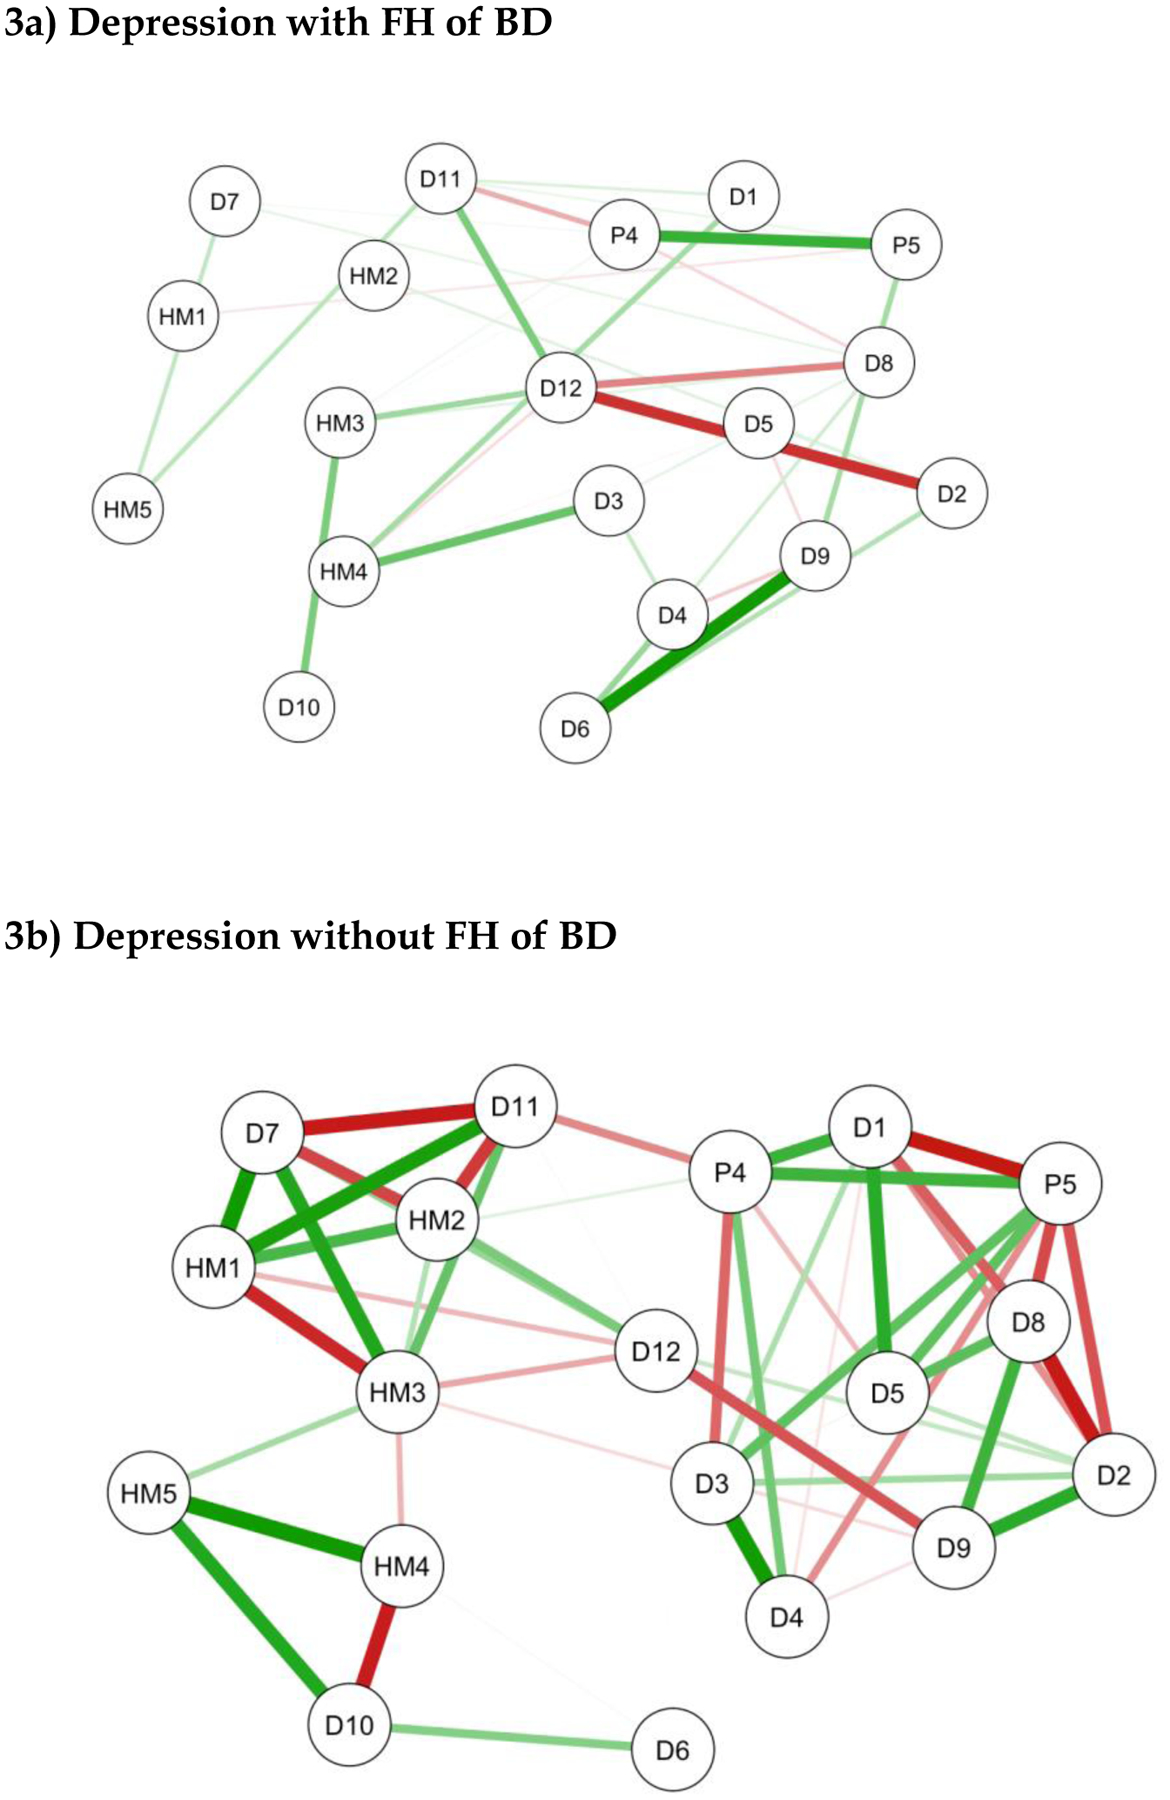
Figure 3: Network Plots for unipolar depression with or without a family history of bipolar disorder (FH BD).

Brief note on the interpretation of network plots- items with stronger and/or more inter-connections are placed closer to each other and more centrally in the network. Green edges represent positive associations between nodes and red edges represent negative associations. The thickness of the connecting lines indicates the edge weight which reflects the strength of association.
KEY-
D1:Nervous/Tense; D2:Unhappy/Depressed; D3:Feel Stressed; D4:Feel Overwhelmed; D5:Lost Confidence; D6:Hopelessness; D7:Somatic Pain; D8:Hypersomnia; D9:Fatigue; D10:Poor Sleep Quality; D11:Poor Concentration; D12:Anergia; HM1: Feeling Elated; HM2: Increased Self-Confidence/Self-Esteem; HM3: Need Less Sleep; HM4: Increased Psychomotor Speed (Speech); HM5: Increased Activity (Physical); P4: Feeling Threatened by Others; P5: Thinking People are Against You.
Four PLE items (P1, P2, P3 and P6) were automatically excluded from the network analysis.
