
Fig. 3:
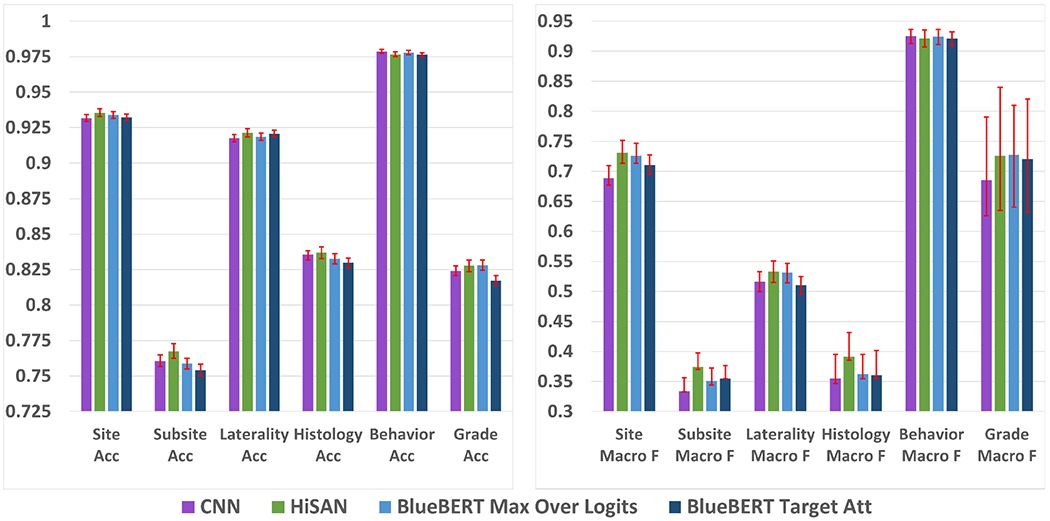
Accuracy (left) and macro F1 scores (right) for each model on the cancer pathology report dataset. 95% confidence intervals are shown in red and calculated using a bootstrapping procedure detailed in Appendix A.
Official websites use .gov
A
.gov website belongs to an official
government organization in the United States.
Secure .gov websites use HTTPS
A lock (
) or https:// means you've safely
connected to the .gov website. Share sensitive
information only on official, secure websites.
Accuracy (left) and macro F1 scores (right) for each model on the cancer pathology report dataset. 95% confidence intervals are shown in red and calculated using a bootstrapping procedure detailed in Appendix A.