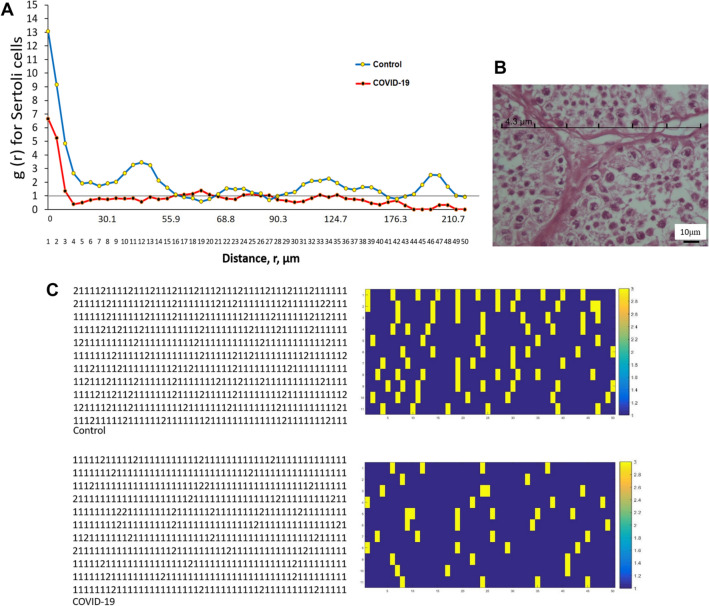
Fig. 4.
The effect of SARS-CoV-2 on the spatial arrangement of Sertoli cells in the human post-mortem using the second-order stereological method. A Communication between pair-correlation function and dipole distance for Sertoli cells in control and COVID-19 groups. The mean points are g(r) in the control and COVID-19 groups. The horizontal reference axis relates to values expected for a random spatial arrangement [g(r) = 1]. B A micrograph that encodes cells to produce a matrix of a transparent lattice of points to serve as a set of dipole probes. Each row consists of 50 points and 49 equal distance intervals. For each testis, 11 tests were performed (a total of p = 550 test points). For each experiment, the nature of the tissue constituent at each test point was determined and all data were recorded in 11 × 50 matrices. The point interval (r) relates to a distance of 4.3 μm, which has a chance of being in the same Sertoli profile. If the dot was placed on Sertoli cells and connective tissue, 1 and 2 were encoded, respectively. C Convert data matrix to image type and display Sertoli cells (1) yellow and connective tissue (2) dark blue. A control group; Group B, COVID-19

