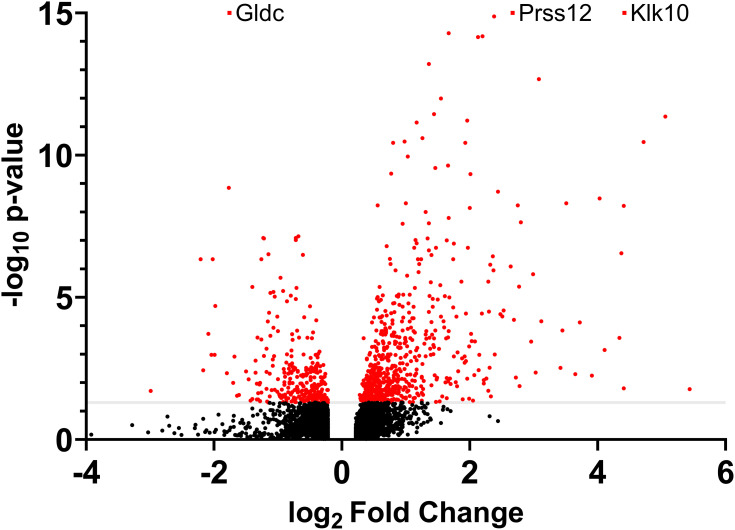
Figure 1.
RNA sequencing analysis of differentially expressed genes in the mammary gland infused with lipopolysaccharide for 12 h compared with the gland treated with PBS (n = 5): Volcano plot. All the genes with a log2-fold change above 0.22 or below −0.22 are shown. The gray line represents the cutoff for an adjusted P-value of 0.05. Red dots represent genes that were statistically significant. Gdlc, Prss12 and Klk10 were more statistically significant than shown on the graph.

