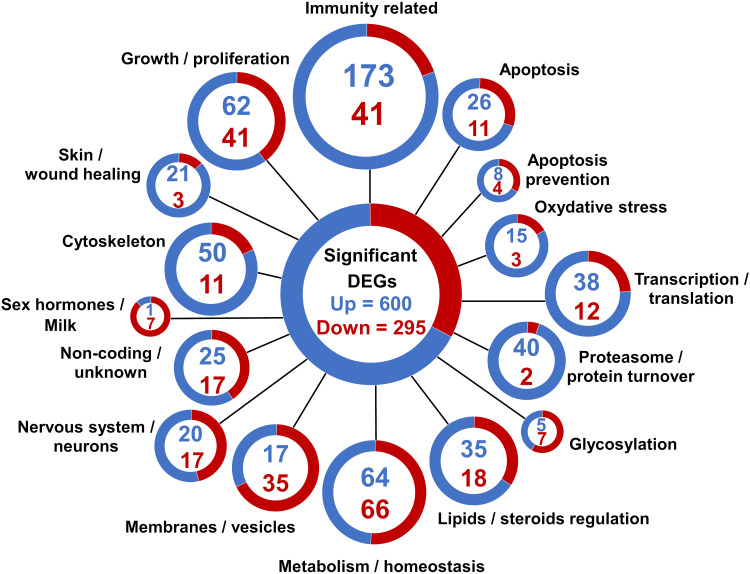
Figure 2.
RNA sequencing analysis of differentially expressed genes (DEGs) in the mammary gland infused with lipopolysaccharide for 12 h compared with the gland treated with PBS (n = 5): Classification of DEGs. Genes were divided into 16 categories based on their gene ontology annotation, sequence homology, known pathways, and literature. Each gene was assigned to only one category. Blue and red colors represent up- and downregulated genes, respectively. The assignments are shown in Table S1.

