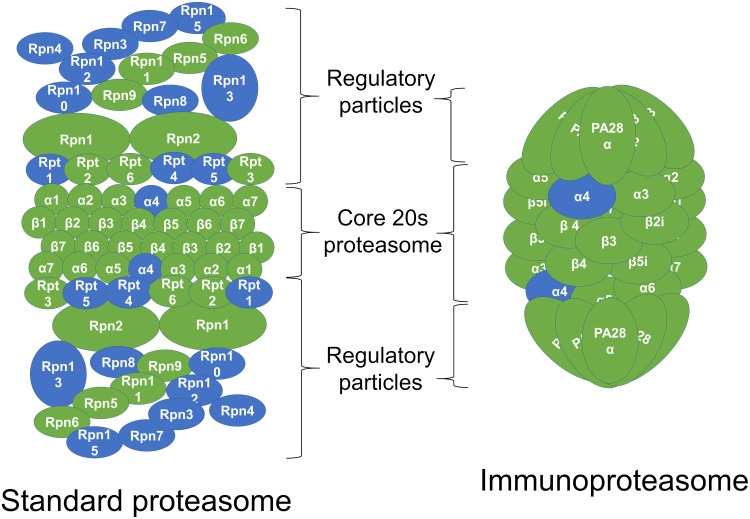
Figure 4.
Upregulation of individual proteasome gene expression by lipopolysaccharide (LPS). In the schematic representation of the standard constitutive proteasome and the immunoproteasome, the subunits in green represent subunits for which the genes were upregulated in the LPS-treated mammary gland compared to the PBS-treated gland in RNA sequencing analysis.

