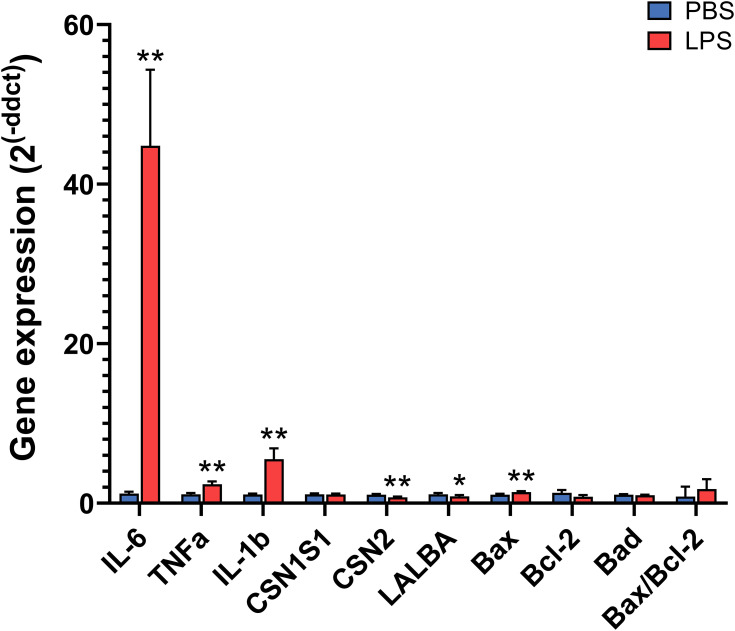
Figure 6.
Relative gene expression in the mammary gland treated with lipopolysaccharide (LPS) for 12 h compared with the gland treated with PBS as determined by quantitative real-time PCR. Gene expression was calculated by the 2−ΔΔCt method and normalized to the levels of the housekeeping genes Actb, Hrpt, Hnrnpab, and Stx5a. Error bars represent standard error (n = 8). *P < 0.05, **P < 0.01.

