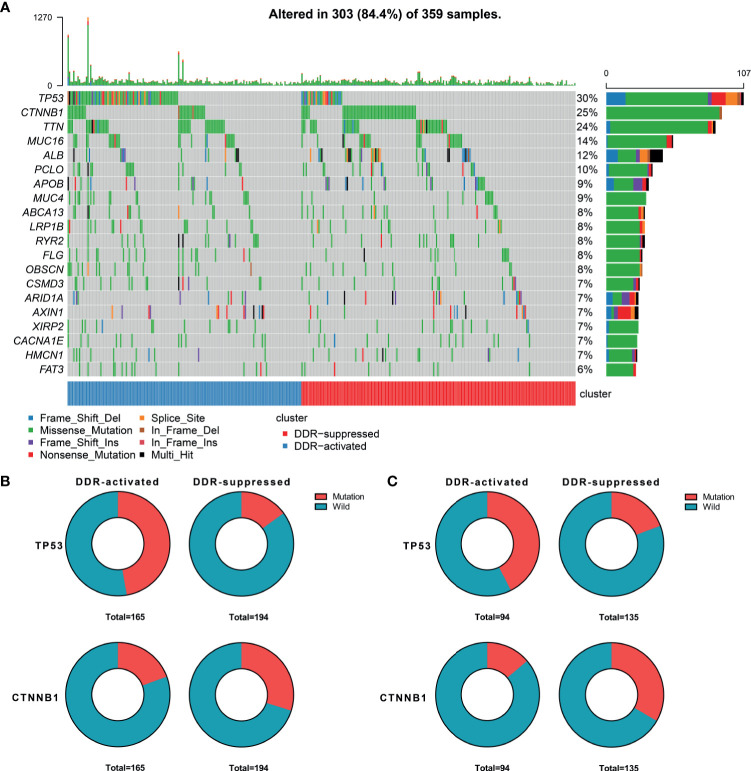
Figure 2.
Genomic alterations between DDR-activated and DDR-suppressed subgroups. (A) Landscape of mutation profiles in HCC samples. Mutation information of each gene in each sample is shown in the waterfall plot. Top panel shows individual tumor mutation burden. The data shown were analyzed based on the TCGA data portal. (B) The mutation rate of TP53 was higher in the DDR-activated subgroup, while CTNNB1 was higher in the DDR-suppressed subgroup in the TCGA dataset. (C) The mutation rate of TP53 was higher in the DDR-activated subgroup, while CTNNB1 was higher in the DDR-suppressed subgroup in the ICGC dataset.

