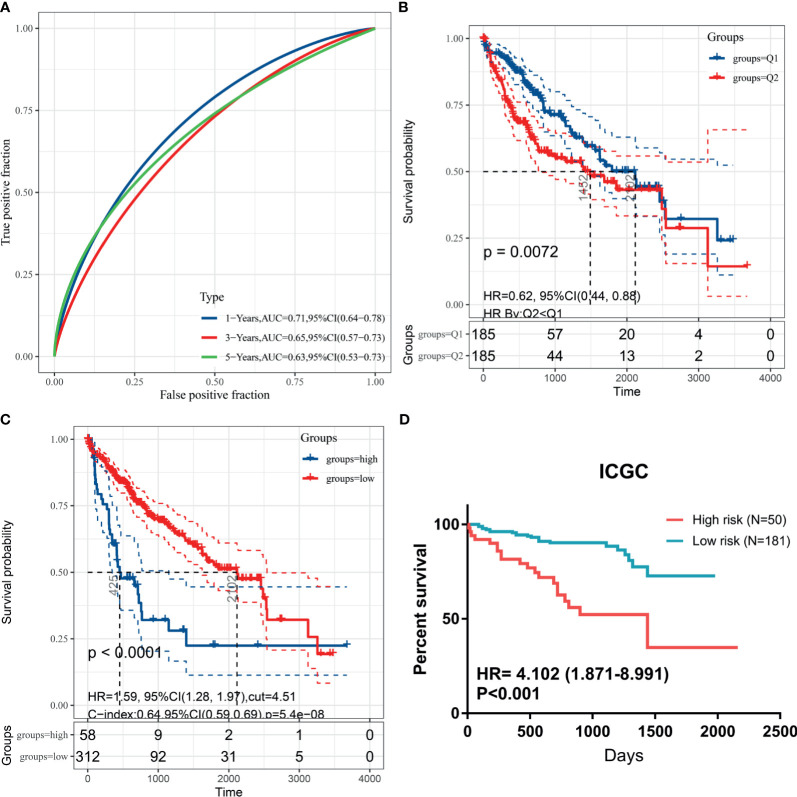
Figure 6.
Kaplan-Meier plots for DDR signature cut-off identification. (A) Time-dependent ROC for DDR signature survival prediction in TCGA database; (B) survival difference between high and low DDR signature based on median value; (C) survival difference between high and low DDR signature based on best separation in training cohort; (D) cut-off from TCGA cohort could be useful for risk stratification in ICGC dataset.

