Figure 3.
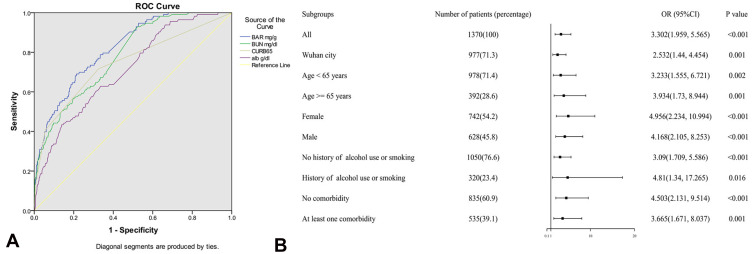
(A) ROC curve of BAR, BUN, albumin and CURB-65 for prediction of critical illness in COVID-19 patients. The AUC were 0.821 (95% CI: 0.784, 0.858; P<0.01) for BAR, 0.783 (95% CI: 0.743, 0.823; P<0.01) for BUN, 0.712 (95% CI: 0.664, 0.760; P<0.01) for albumin, and 0.744((95% CI: 0.690, 0.798; P<0.01) for CURB-65, respectively. The optimal predictive cut-off value of BAR was 3.7887 mg/g (specificity: 0. 690; sensitivity: 0.786). (B) Subgroup analysis for OR of COVID-19 patients with BAR ≥ 3.7887 mg/g versus BAR < 3.7887 mg/g stratified by area, age, sex, history of drinking or smoking, and comorbidity. P values were calculated by multivariate Logistics regression analysis.
Abbreviations: ROC, receiver operating characteristic; BAR, blood urea nitrogen to serum albumin ratio; COVID-19, coronavirus disease 2019; AUC, area under the curve; OR, odds ratios; 95% CI, 95% confidence interval.

