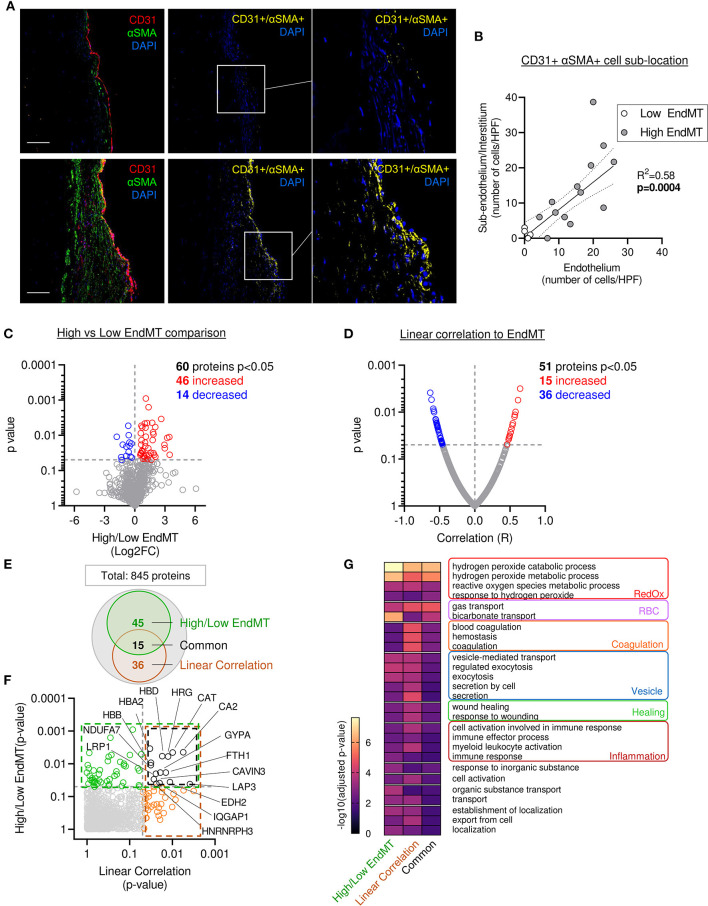
Figure 5.
Mitral leaflets displaying EndMT are associated with proteomic change associated to, oxidative stress-, inflammatory- and vesicle-related processes. (A) Representative mitral valve section from patient with different range of cellular composition, (patients #10 upper panel and #12 bottom panel) stained for DAPI (blue), CD31 (red), αSMA (green) merge on the left panel (scale bar represent 100 μm). CD31 and αSMA double positive areas are represented in yellow (two right panels). (B) Sub localization of EndMT cells (CD 31+αSMA + DAPI+) between endothelium layer (x axis) and sub endothelium and interstitium area (y axis). (C) Comparison of proteomic composition from the four samples having low level of EndMT (white dots in B) vs. the 13 other samples with higher level of EndMT (gray dots in B). Volcano plot displaying the Log2 fold change (x axis) against the statistical p-value (log scale) for all 845 proteins detected. Proteins with significantly increased expression (Log2FC > 0, p < 0.05) in sample with high level of EndMT are shown in red, while the proteins with significantly decreased expression (Log2FC > 0, p < 0.05) are presented in blue. (D) Comparison of proteomic using linear correlation with EndMT quantification (CD31+αSMA+ area normalized to total CD31+). Dot plot displaying R2 (x axis) against the statistical p-value (Log scale) for all 845 patients detected. Proteins with significant and positive correlation (R > 0, p < 0.05) to EndMT are shown in red, while the proteins with significant and negative correlation (R > 0, p < 0.05) are presented in blue. (E) Venn diagram displaying the significantly modulated proteins obtain from the linear correlation to EndMT (dark orange) and Low vs. High EndMT comparison (green) and common proteins (black). (F) Dot plot exhibiting p-value of 845 patients identified from both analyses. Common proteins are indicated in black. (G) Gene ontology biological process (GO:BP) from protein significantly modulated in the low vs. high EndMT comparison, linear correlation to EndMT, or only in the common proteins.

