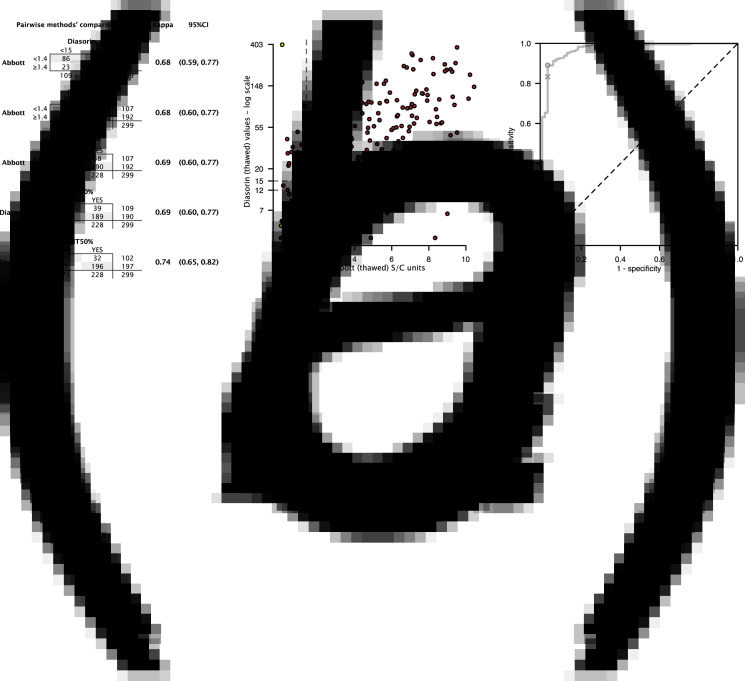
Fig. 1.
Antibody test performance evaluations. (a) Pairwise comparisons and κ statistics with their 95% CIs across all antibody assays and PRNT at 50%. (b) Scatterplot of the Abbott assay results (x-axis) vs. the Diasorin assay results (y-axis, in logarithmic scale), in the context of PRNT results (yellow dots: negative; brown dots: positive). Dashed lines indicate the clinically relevant thresholds for positivity. (c) ROC curve used to define the optimal cut-off for S/C (AAI) values as a classifier. Plotted here is the true-positive rate (sensitivity) vs. the false-positive rate (1 – specificity) for increasing values of AAI for all 299 individuals subject to PRNT. The diagonal corresponds to the ROC curve of a random classifier. Discriminative classifiers produce curves drawn towards the upper left corner, where sensitivity = specificity = 1. A perfectly discriminating classifier generates a ROC curve that starts at the lower left corner and advances as a vertical line to the upper left corner and from there horizontally to the upper right corner. The cross corresponds to the classifier performance using AAI = 1.4. In the sample under investigation, optimal classifier performance is achieved for AAI = 1.16 (circle).

