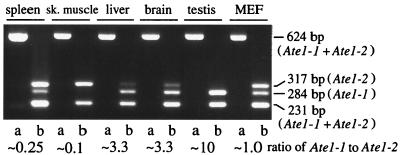
FIG. 3.
Expression of Ate1-1 and Ate1-2 mRNAs in different mouse tissues and mouse embryonic fibroblasts (MEF). Two forms of Ate1 cDNA (Fig. 2A) were amplified in a single reaction by RT-PCR, using the same primers, to yield 624-bp fragments that included the region of the alternative 129-bp exons (see Materials and Methods). The 624-bp fragments were digested with ScrFI, which produced a 231-bp fragment (a mixture of Ate1-1 and Ate1-2), a 284-bp, Ate1-1-specific fragment, and a 317-bp, Ate1-2-specific fragment. The untreated (lanes a) and ScrFI-treated (lanes b) samples from different mouse tissues were analyzed by electrophoresis in a 2% agarose gel. The ratio of the two forms of Ate1 mRNA, defined as the ratio of the 284-bp (Ate1-1) fragment to the 317-bp (Ate1-2) fragment, was determined by analyzing serially diluted samples and comparing the resulting band intensities (data not shown). sk., skeletal.

