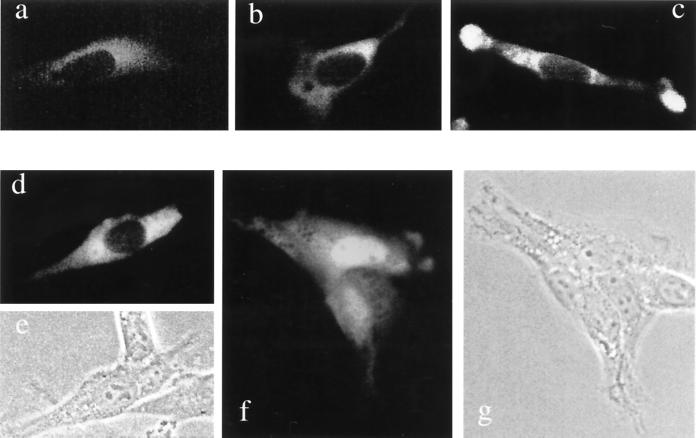
FIG. 7.
Intracellular localization of mouse ATE1-1p and ATE1-2p. Shown are green (GFP) fluorescence (a to d and f) and phase-contrast (e and g) micrographs of mouse NIH 3T3 cells transiently transfected with ATE1-1p-GFP (d to g) or ATE1-2p–GFP (a to c) fusion proteins (see Materials and Methods). Panels a to c show different examples of the exclusively cytosolic localization of ATE1-2p. Regions around the nucleus and in the lamellar protrusions at the edges of a cell (c) exhibit higher GFP fluorescence, possibly because of a greater thickness of cells in these areas. Panels d plus e and f plus g show pairs of GFP fluorescence and phase-contrast pictures of cells that express ATE1-1p-GFP. The cell in panels d and e shows ATE1-1p-GFP in the cytosol but not in the nucleus. Cells in panels f and g contain ATE1-1p-GFP in both the cytosol and the nucleus, the latter being apparently enriched in ATE1-lp-GFP.

