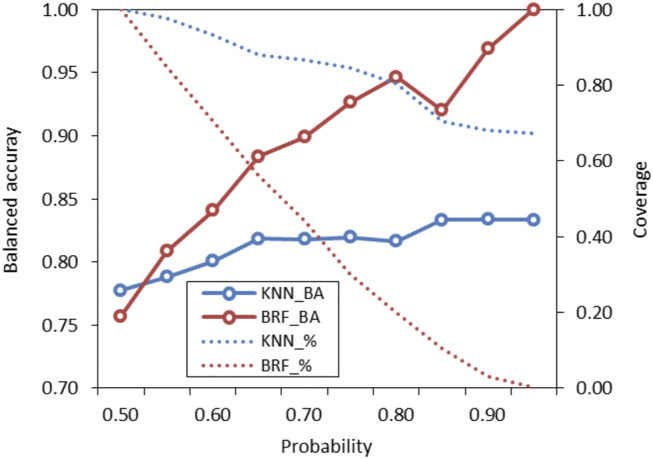
FIGURE 5.

Variation of performance of the KNN and the BRF models on the ES based on probability threshold for prediction domain definition. Solid lines refer to the overall BA while dotted lines refer to the percentage of compounds included in the domain of the model (coverage) on the total included in the ES.
