


Figure 1.
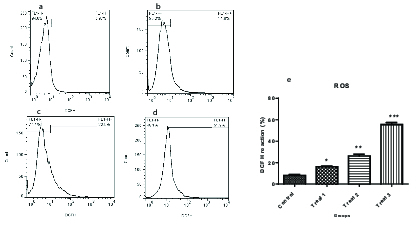
Dichlorofluorescin diacetate flow cytometry in human spermatozoa after exposure to different concentrations of AA (a: 0, b: 0.5, c: 1, and d: 2 mM). Comparison of human spermatozoa ROS levels in different groups of treatment (e).
Official websites use .gov
A
.gov website belongs to an official
government organization in the United States.
Secure .gov websites use HTTPS
A lock (
) or https:// means you've safely
connected to the .gov website. Share sensitive
information only on official, secure websites.
Dichlorofluorescin diacetate flow cytometry in human spermatozoa after exposure to different concentrations of AA (a: 0, b: 0.5, c: 1, and d: 2 mM). Comparison of human spermatozoa ROS levels in different groups of treatment (e).