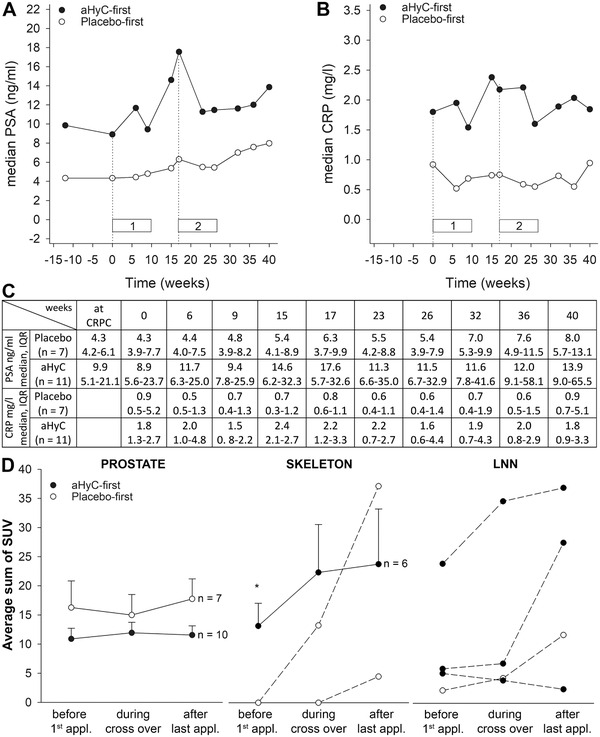
FIGURE 2.

The analysis of prostate‐specific antigen (PSA), C‐reactive protein (CRP), and [18F]fluorocholine PET–CT lesions. Graphical presentation of clinical parameters: PSA (A) and CRP (B) over the trial period, with numerical values (C). Following aHyC treatment, PSA decreased transiently in nine patients and permanently in one patient, but median serum PSA levels determined at several time points increased after aHyC and placebo. Time points compare median values in each group, including at the time of CRPC diagnosis (12 weeks), at the baseline (at first application, time 0), just before the crossover (17 weeks), around the time of the last application (23 weeks), and 4 months after it (40 weeks). In each group, one patient was excluded from this analysis (death and chemotherapy). Interquartile ranges are omitted for clarity but are given in Table (C). Dotted vertical lines denote the time of first applications: at the beginning of the trial and at the crossover; horizontal bars denote the length of the first (1) and second (2) application rounds. (D) Average (solid lines) and individual (dashed lines, for n < 5) standardized uptake values (SUVs) of lesions visualized by [18F]fluorocholine PET–CT in prostate, skeleton, and lymph nodes (LNN) shown at three measured time points: just before the first application of placebo or aHyC, at the time of crossover, and after concluding the second round of treatment in the crossover phase. Data were analyzed only in patients with lesions in a certain region. Error bars are SEM and are shown only in the positive direction for transparency. Paired and unpaired Student's t‐tests were used, as appropriate. The asterisk denotes a statistically significant difference between both groups (P < 0.05)
