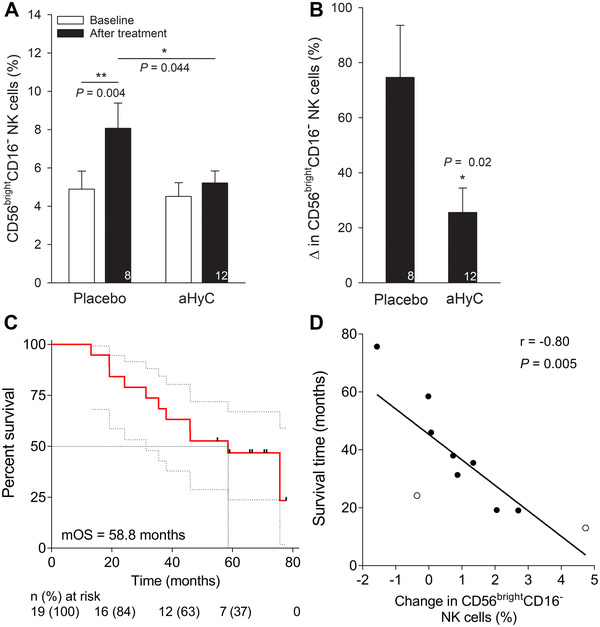
FIGURE 3.

Survival of aHyC‐treated patients correlates with changes in peripheral blood CD56brightCD16− natural killer cells. During the trial, the CD56brightCD16− subpopulation of natural killer (NK) cells was measured in the blood samples as the percentage of all NK cells. (A) Changes in the percentage of the CD56brightCD16− NK cell subpopulation in the placebo‐first (left columns) and in the aHyC‐first groups (right columns) at baseline (open columns; time period of up to 4 months before the first application) and before the crossover (black columns). Note that the CD56brightCD16− fraction of NK cells significantly increased only in the placebo‐first group compared to baseline. (B) Relative change (%) in CD56brightCD16− NK cell subpopulation relative to baseline after placebo and aHyC application, respectively. Bars represent mean values with SEM, and the numbers of patients are shown within the bars. Paired and unpaired Student's t‐tests were used, as appropriate, *P < 0.05. (C) Kaplan–Meier plot of overall survival (OS) with 95% confidence interval (gray curves) in all patients who were treated with aHyC (n = 19). Survival time was measured from the first application of aHyC until cutt‐off date or death. Black symbols denote censored subjects; dotted lines denote median value, n (%) denotes the numbers of patients at risk. (D) The correlation between survival time of deceased patients (n = 10; from PCa—black symbols, other causes—open symbols) and changes in percentages of CD56brightCD16− NK cells relative to baseline, determined after the crossover. r represents Pearson correlation coefficient. The regression line is of the form: Survival time [months] = (–8.8 ± 0.3 [months/%]) × change in CD56brightCD16− NK cells [%] + (45.3 ± 4.6 [months])
