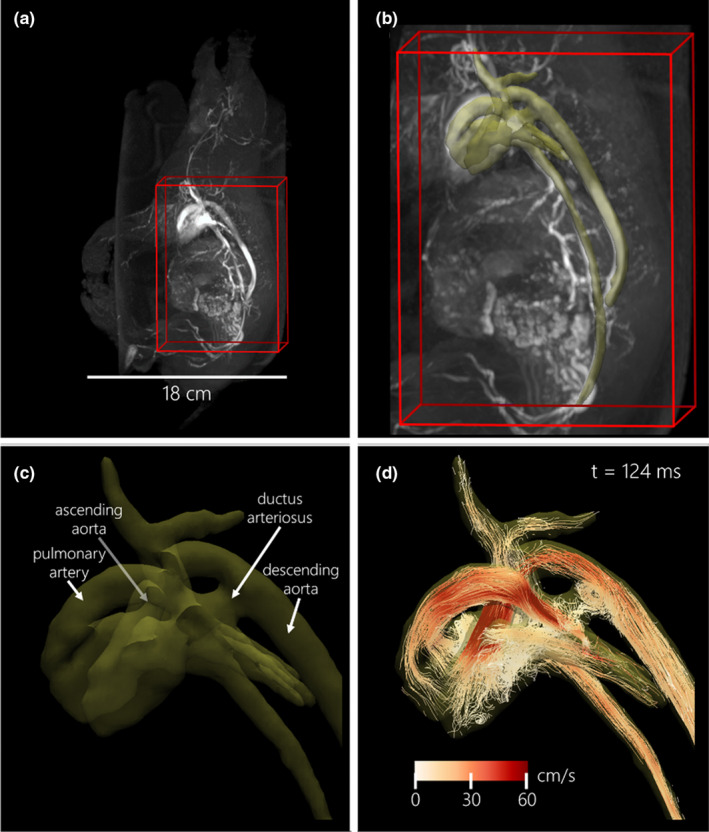
FIGURE 1.

Example left lateral neonatal piglet images in a T‐3 1.4 kg male with open ductus arteriosus. (a) Whole piglet time‐of‐flight vascular imaging is used to prescribe the 4D flow acquisition (red wireframe). (b) Cardiac vasculature segmentation (yellow 3D rendering) is based on cardiac time‐averaged blood speed. (c) Zoomed view of labeled cardiac vessels of interest. (d) Particle trace visualization (color‐coded based on blood speed) at end‐systole (cardiac time = 124 ms)
