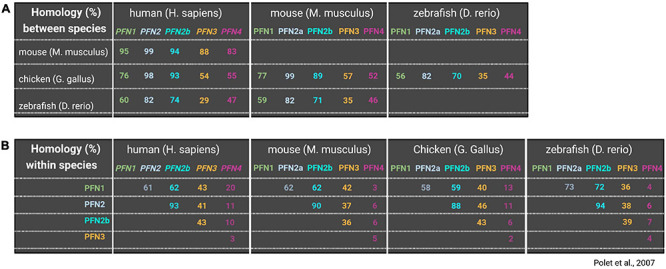
FIGURE 1.

Comparison of profilin isoform amino acid sequences between and within organisms. Upper panel (A) shows homologies (%) of all profilins between different species including human, mouse, chicken and zebrafish. Lower panel (B) shows homology (%) of different profilins within the same species (lower panel). Blank squares were left blank to avoid redundant information. Information on profilin homologies are based on Polet et al. (2007).
