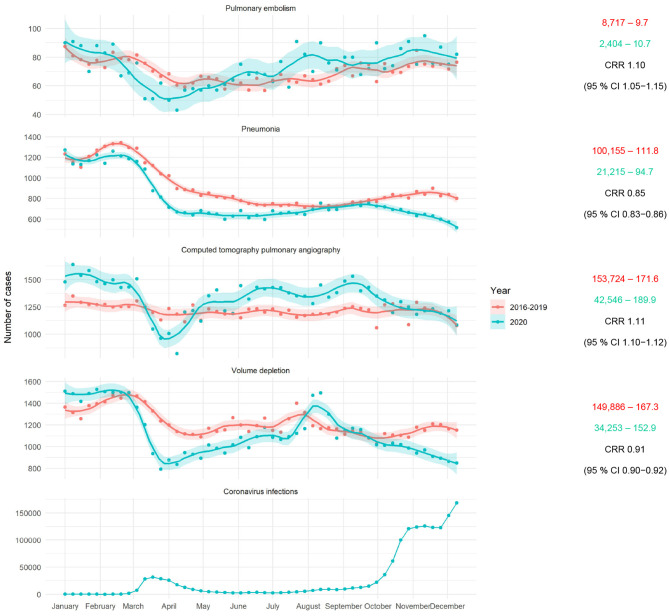
Figure 1.
Left: Total weekly hospital admissions for pulmonary embolism, non-COVID-19 pneumonia, CTPA, volume depletion, and new SARS-CoV-2 infections in Germany (from top to bottom). Smooth curves for weekly admission rates were fitted via locally weighted scatterplot smoothing (LOESS) with a degree of smoothing of α = 0.2. Shaded areas represent 95% CI. Right: Total and daily admissions, and resulting CRR with 95% CI between May 6 and December 15, 2020, and the corresponding control period 2016–2019.

