
Figure 2. Synoptic Summary of Lesion Location and Fluorescence.
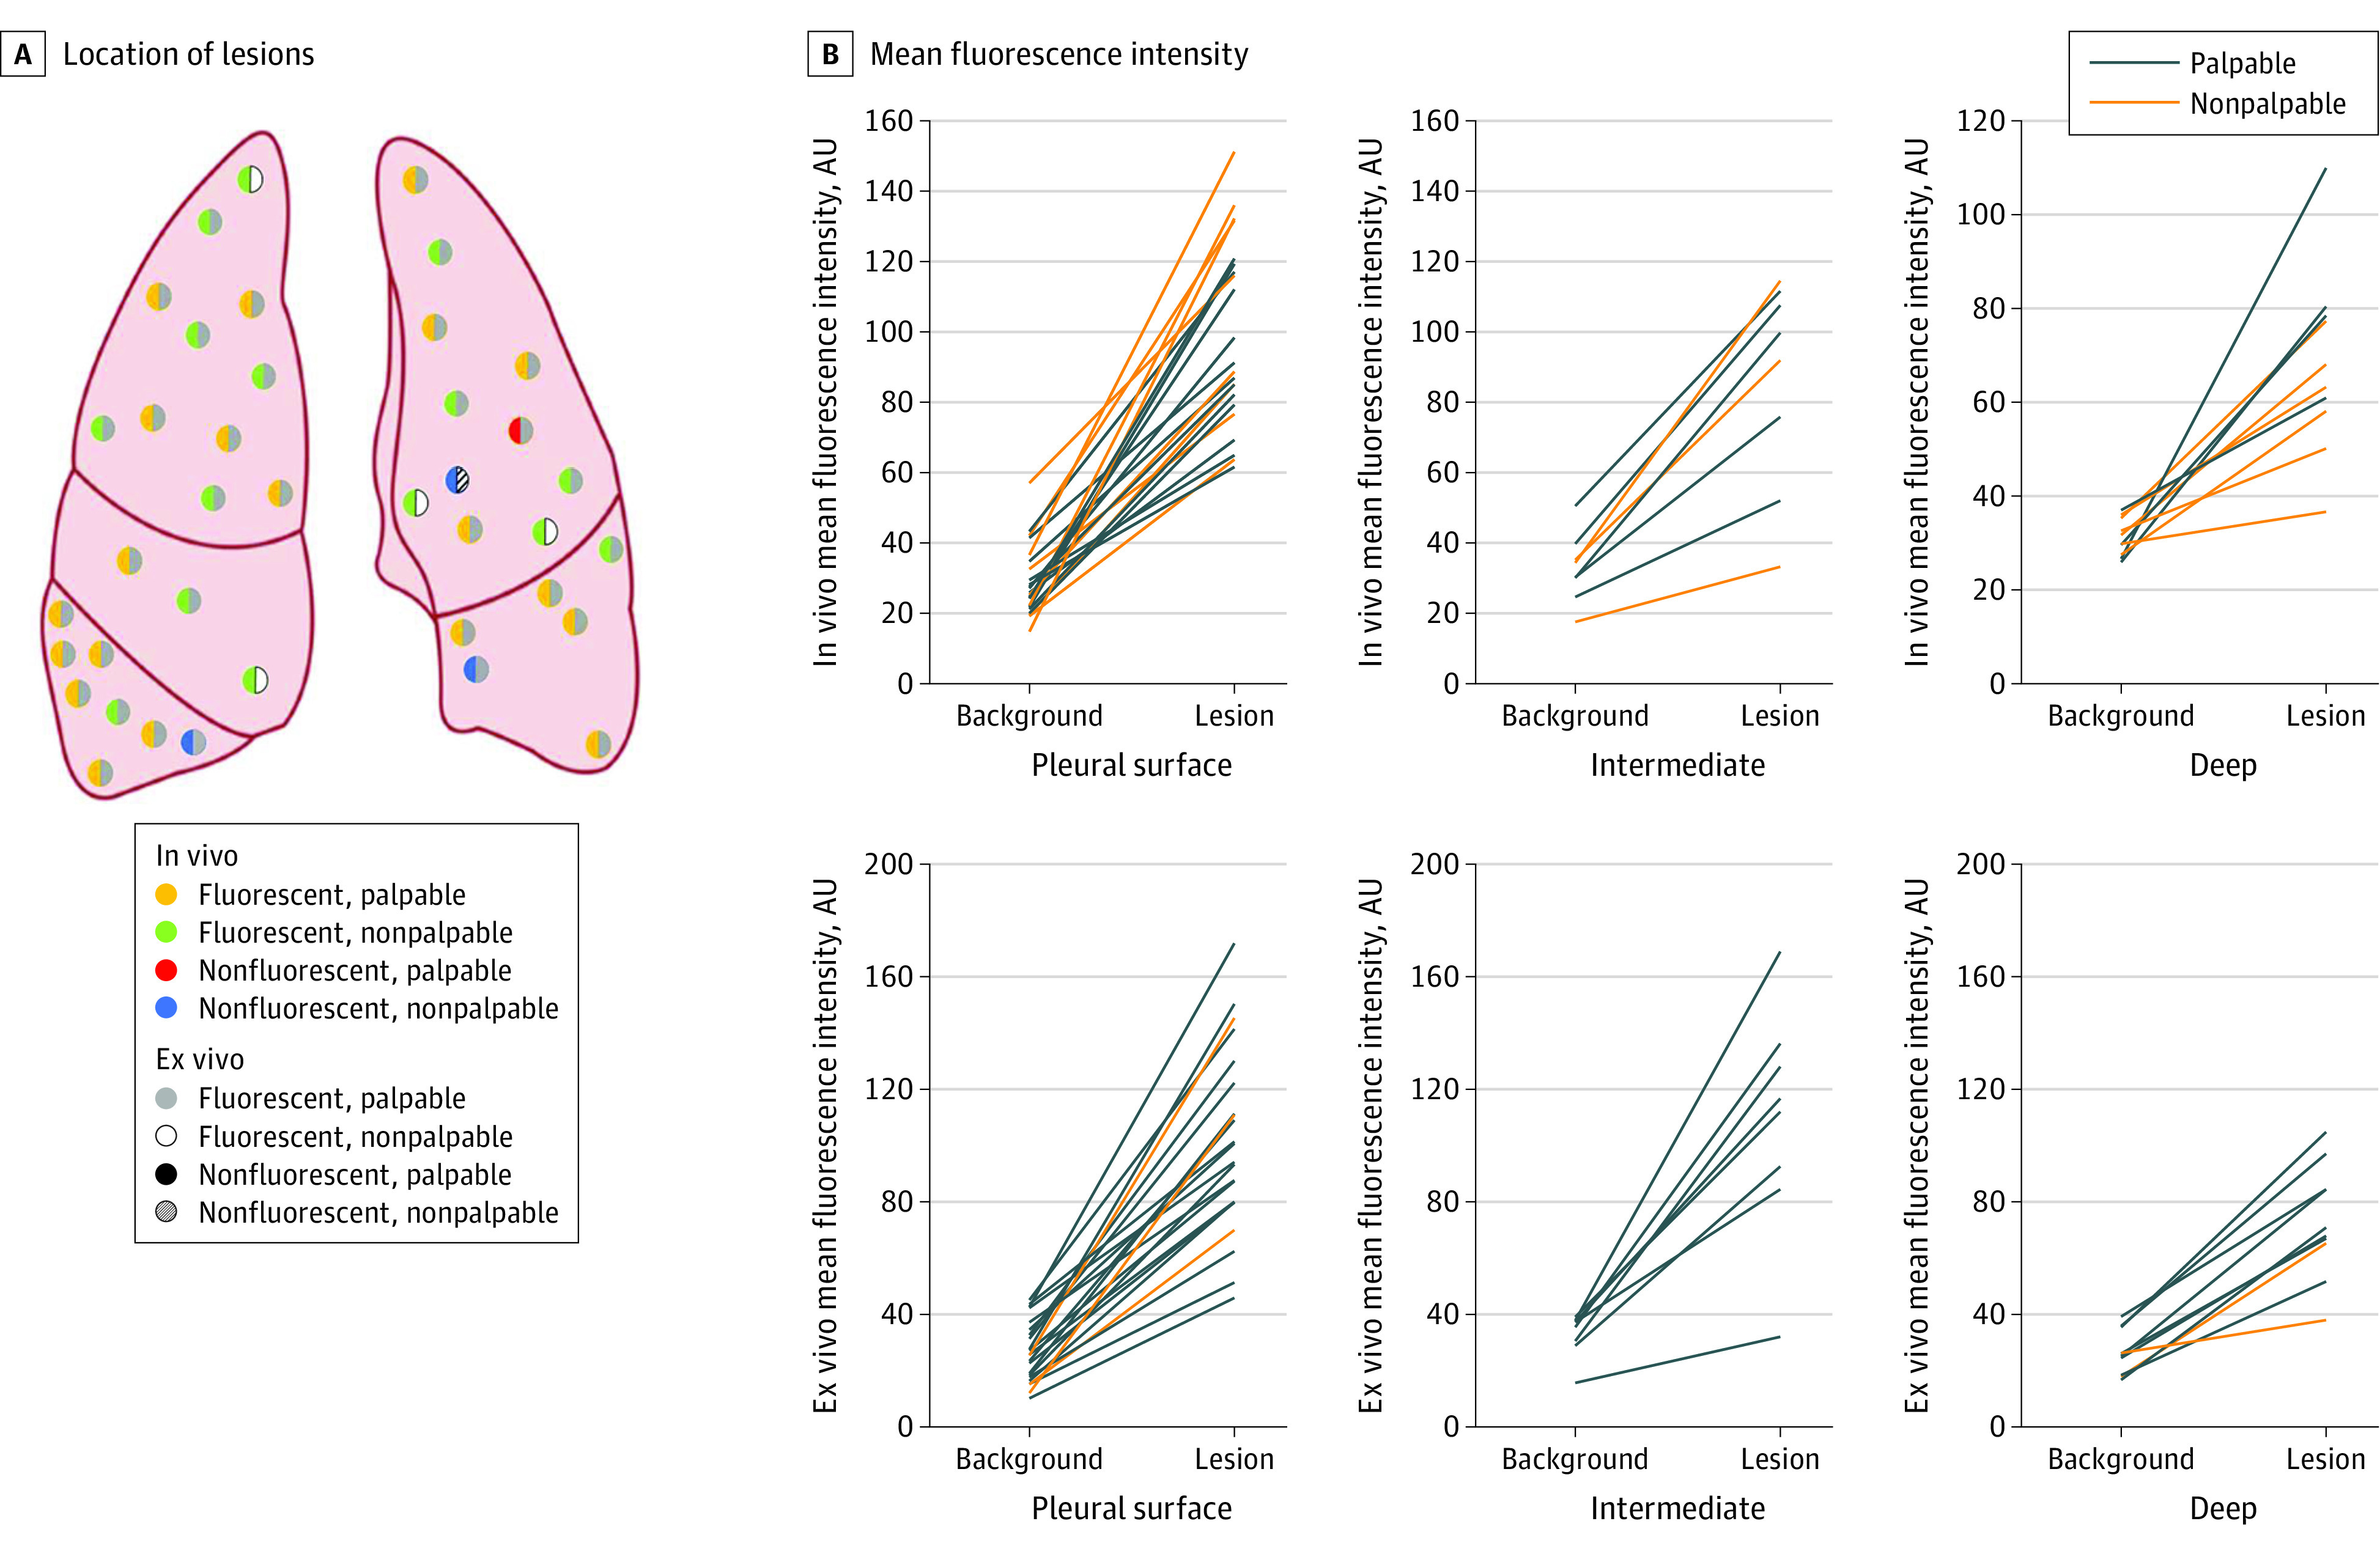
A, Location of lesions with color schema describing palpability and fluorescence. The color in the left hemisphere of each nodule denotes in vivo properties, and the color in the right hemisphere denotes ex vivo properties. B, Mean fluorescence intensity of lesion and background measurements, stratified by depth (surface, intermediate depth [0.01-0.99 cm], and deep lesions [≥1 cm]). Each line links lesion and background measurements from the same individual. AU indicates arbitrary unit.