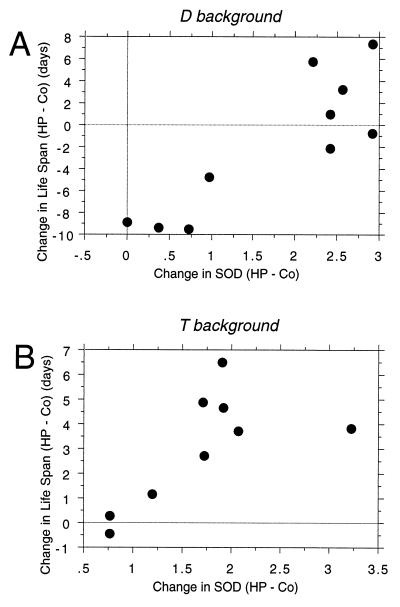
FIG. 5.
Correlation of SOD overexpression with life span. The amount of Cu/ZnSOD overexpression (HP minus Co), in arbitrary Cu/ZnSOD enzyme activity units, was plotted against the change in life span (HP minus Co), in days, in scatter plots. (A) D genetic background, data from Fig. 3C and D and Table 3; r = 0.87, P = 0.0005. (B) T genetic background, data from Fig. 3F and G and Table 3; r = 0.70, P = 0.047.

