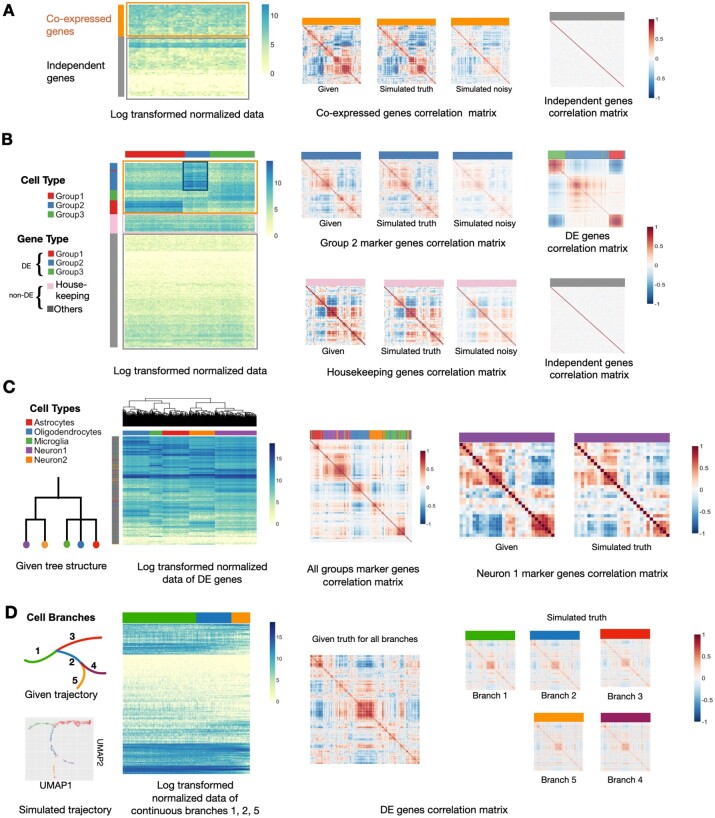
Fig. 2.
ESCO can simulate scRNA-seq data of various cell heterogeneity and gene co-expression. (A) The simulation results for one homogeneous cell group consisting of 200 cells and 500 genes. The first panel displays the heatmap of log2 transformed normalized simulated expression data, where rows represent genes and columns represent cells; 30% of genes are chosen to be co-expressed genes, and the rest are independent genes. The following displays depict, in order, the given correlation structure for co-expressed genes, the simulated correlation structure among those co-expressed genes without noise, and that with technical noise, and the simulated correlation structure for independent genes. (B) The simulation results for three discrete heterogeneous cell groups consisting of 500 cells and 1000 genes. 30% of the genes are chosen to be cell-type DE genes and presumably co-expressed, among which each marks one cell type. Another 10% of genes are chosen to be housekeeping genes, and also presumably co-expressed. The rest are independent non-DE genes. The first display shows the heatmap of log2 transformed normalized simulated data, where different gene types (rows) and cell types (columns) are marked with color bars on the margin. The following displays depict, in order in each row, the given correlation structure for both marker genes of Group2 and co-expressed housekeeping genes, the simulated correlation structure among those co-expressed genes without noise, and that with technical noise; and, at the end of each row the simulated correlation structure among all DE genes across all cells, and that among all independent genes across all cells, with corresponding gene types marked with a color bar on top. (C) The simulation results for five heterogeneous cell groups that follow a tree structure given in the first panel. We simulate 1000 cells and 2000 genes: 30% of genes are chosen to be DE genes and presumably co-expressed, among which 5% are markers; the rest are independent non-DE genes. The second panel shows the heatmap of log2 transformed normalized simulated data. Different cell types are marked with color bars on the column margin, together with the hierarchical clustering of cells. The following displays depict, in order, the resulting correlation structure among all marker genes across all cells, with corresponding gene types marked with a color bar on top; the given correlation structure for co-expressed marker genes of Neuron1 cells, and the resulting correlation structure among those co-expressed genes. (D) The simulation results for five heterogeneous cell groups that follow a smooth cell trajectory structure given in the top left panel. There are 1000 cells and 2000 genes; 30% of genes are chosen to be DE genes and presumably co-expressed and share the same correlation structure within each branches, and the rest are independent non-DE genes. The following displays depict, in order, the UMAP for the first two dimensions of the simulated data, the heatmap of log2 transformed normalized simulated data for all DE genes in one continuous path (i.e. branches ), with branch ID marked with a color bar on top; the given shared correlation structure for the DE genes, and the resulting correlation structure simulated of those genes within each branch

