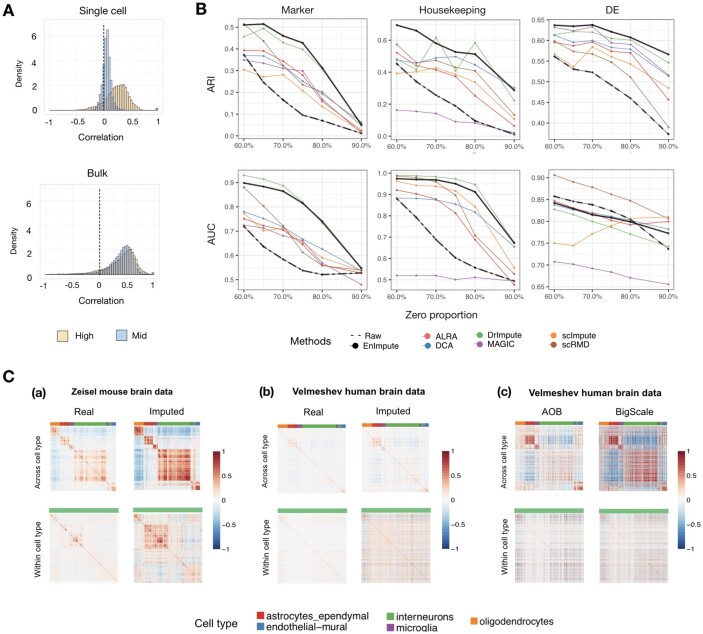
Fig. 3.
Application of ESCO in benchmarking imputation for gene co-expression recovery. (A) Evidence that sparsity attenuates gene co-expression. The top panel depicts the histogram of Pearson’s correlations for the 1000 highest expressed (0–10% quantile) genes and 1000 moderately expressed genes (60–70% quantile) in Velmeshev scRNA-seq data. The bottom figure depicts the histogram of Pearson’s correlations for the same genes as in the top panel, but using the corresponding bulk data. (B) The performance of different imputation methods on recovering the gene co-expression. We simulate 1000 genes and 200 cells for three cell groups, using the parameters estimated from the Zeisel data, and aggregate the results from 10 replicates. The corresponding ARI score and AUC score (represented by each row) of each imputation method versus different sparsity levels (represented by zero proportion) on different types of gene co-expression (represented by each column, respectively, as marker genes, housekeeping genes, DE genes) are plotted. (C) Verification of the findings of imputation using real data. (a) The correlation matrix of marker genes before and after imputation of Zeisel data, across cell types (five in total) and within one cell type (interneurons). (b) The correlation matrix of marker genes before and after the imputation of the Velmeshev data. (c) The correlation matrix of marker genes of the Velmeshev data after AOB and BigScale aggregation

