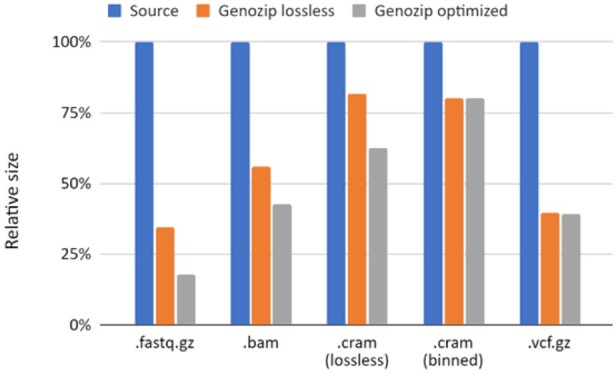
Fig. 2.

Sizes of Genozip-compressed files relative to already-compressed source files.The blue bars represent the source files (see Table 1), with the corresponding file extensions at the bottom. The orange and grey bars are for Genozip compression with the default, lossless mode and the –optimise option, respectively. See also results in Supplementary Table S11
