
Fig. 3.
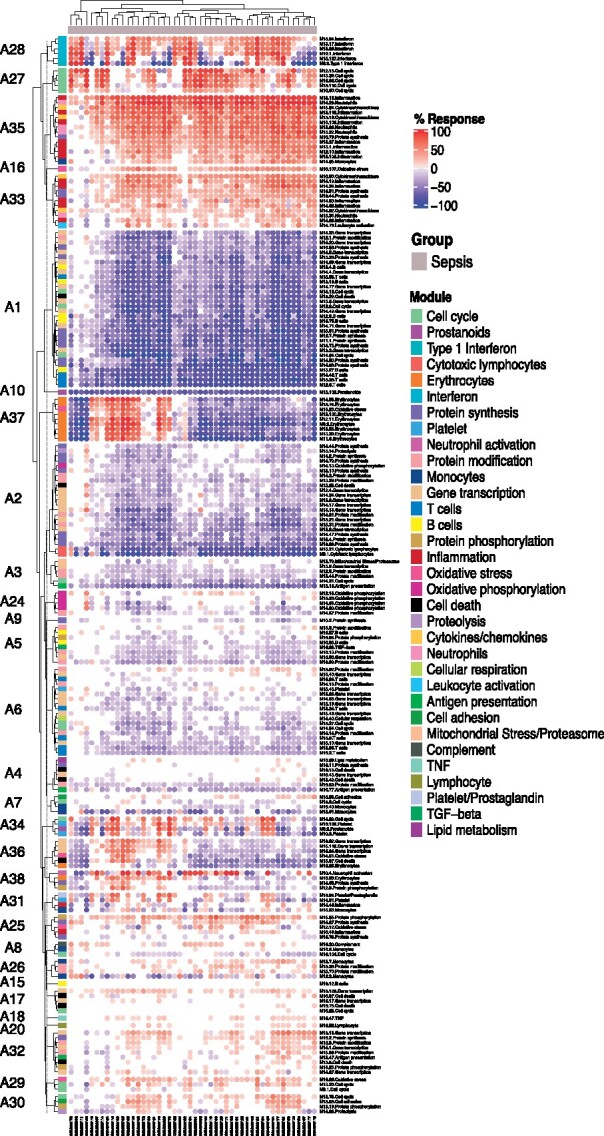
Fingerprint heatmap displaying patterns of annotated modules across individual study subjects. The heatmap displays the abundance patterns of 141 annotated modules for which at least 20% of constitutive genes were differentially expressed in at least one subject. Both samples (columns) and modules (rows) were arranged via hierarchical clustering. The proportions of the differentially expressed transcripts are indicated by a color gradient ranging from blue (100% of transcript decreased) to red (100% of transcripts increased)