Fig. 1.

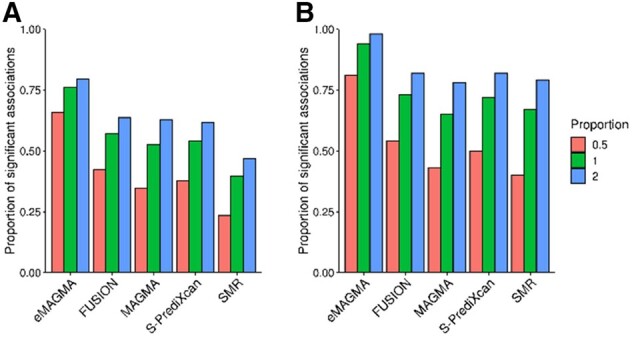
Proportion of significant associations (A) relative to the total number of causal genes and (B) relative to the total number of causal genes per method. Legend: 0.5%, 1% and 2% denote the percentage of phenotypic variance explained by eQTLs

Proportion of significant associations (A) relative to the total number of causal genes and (B) relative to the total number of causal genes per method. Legend: 0.5%, 1% and 2% denote the percentage of phenotypic variance explained by eQTLs