
Figure 3. Time‐variable kinetic rates shape curvature of gene activation.
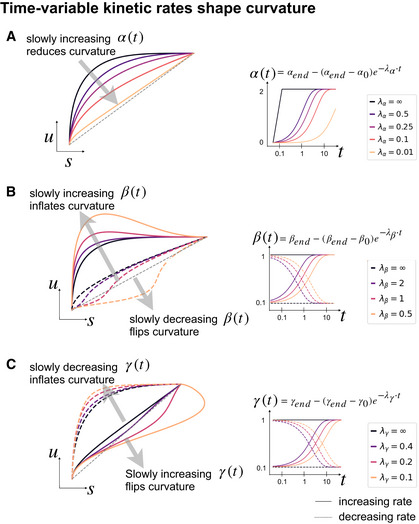
(A) Time‐dependent kinetic rates shape the curvature patterns of gene activation. A slow increase in transcription rate rather than a stepwise activation deflates the curvature and thus decreases the statistical power. (B) A slow increase in splicing rates inflates the curvature while a slow decrease in splicing rates flips the curvature. That results in a convex curve, which yields negative velocities and gets incorrectly interpreted as down‐regulation. In the worst case, this can also cause a direction reversal in the projected velocities. (C) The impact of time‐dependent degradation rates is inverse to time‐dependent splicing rates. A slow decrease in degradation rates inflates the curvature while a slow increase in degradation rates flips the curvature.