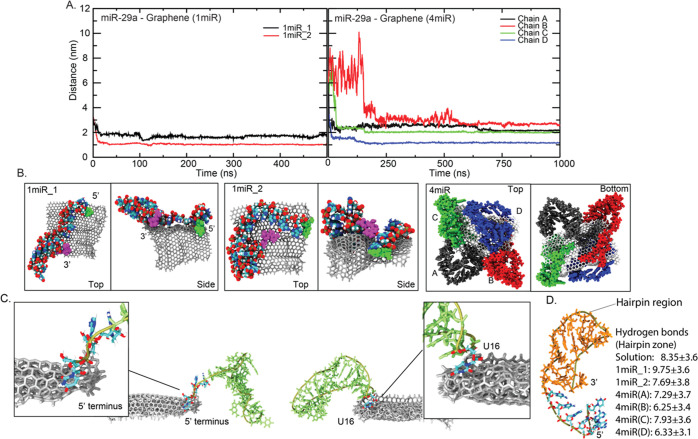
Figure 2.
(A) Distances between miR-29a and GRA in 1miR and 4miR systems. The final orientations of miR-29a on the GRA surface for all systems are shown in (B). The 3′ and 5′ ends are displayed in magenta and green VDW beads. The two binding zones of miR-29a to GRA are shown in (C). (D) Number of average hydrogen bonds between nucleobases in a hairpin structure (orange area) in all systems compared to folded miR-29a in solution, where standard deviations are also included. Hydrogen bonds are calculated from 50–100 ns in miR-29a in solution, 250–500 ns in 1miR, and 500–1000 ns in 4miR.

