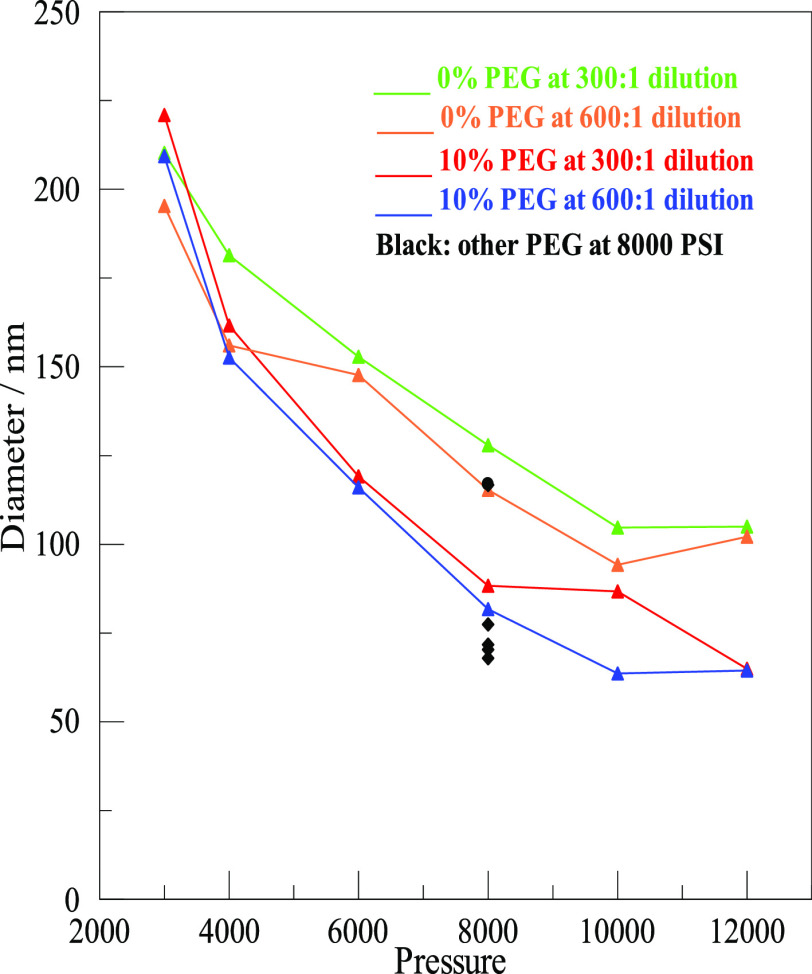
Figure 3.
Average diameters of nanodrops as a function of pressure, both with and without PEG, and at two different dilutions. The concentration of PEG (w/v) in the aqueous phase and the dilution of the emulsion for DLS measurement are given in the inset. At 8000 psi, the black symbols are for additional PEG concentrations, as detailed in the text.

